Movement Characteristics during the Breeding Season of Common Kestrel (Falco tinnunculus) in Wonju City, South Korea
Ⓒ The Korean Environmental Sciences Society. All rights reserved.
This is an Open-Access article distributed under the terms of the Creative Commons Attribution Non-Commercial License (http://creativecommons.org/licenses/by-nc/3.0) which permits unrestricted non-commercial use, distribution, and reproduction in any medium, provided the original work is properly cited.
Abstract
This study was aimed to analyze the movement characteristics during the breeding season of the common kestrel (Falco tinnunculus), an umbrella species well adapted to cities, and to provide basic data for establishing urban biodiversity management policies for their conservation. F. tinnunculus was tracked using a global positioning system (GPS) at 2 h intervals from March to July 2022 in Wonju City, a complex urban and rural city in South Korea. Home-range analysis using the minimum convex-hull polygon and kernel density analysis were conducted, and land-use characteristics were analyzed based on GPS points. Cluster analysis was conducted according to the results of land use over time, and the characteristics of land use among three groups of common kestrels (divided by the amount of movement; (March to April, May to July [daytime], and May to July [nighttime]) were analyzed using the Kruskal–Wallis and Mann–Whitney U tests. We found that the movement area range of F. tinnunculus during the breeding season was 4.17–23.33 ㎢ and that the home-ranges were restricted during mating and egg brooding, but the movement radius expanded rapidly in April. Furthermore, the differences in land use among the groups were statistically significant for urbanized areas, wetlands, forests, and farmlands.
Keywords:
Urban biodiversity, Urban raptor, GPS tracking, Home-range, Umbrella species, Land use1. Introduction
Wildlife habitats are decreasing due to rapid urbanization and urban expansion worldwide; thus, the Kunming-Montreal Global Biodiversity Framework has recommended that countries continue to expand the quality management of protected areas and other effective area-based conservation measures (OECMs) in urban and natural areas (Convention on Biological Diversity [CBD], 2021). The CBD predicts that the world's human population will continuously increase until 2050, and more than 60% of the population will live in urban areas (CBD, 2020); therefore, research on preserving biological habitats and improving biodiversity in the future is important. In particular, habitat damage and reduction in wildlife are serious because of large-scale development projects in cities (Vitousek et al., 1997); thus, it is essential to continuously monitor and accumulate fundamental research on major species, along with policy management through landscape ecological plans for the conservation and restoration of urban ecosystems (Pettorelli et al., 1997).
Among urban species, birds of prey, especially raptors, are the top predators and umbrella species in cities and effectively protect the food chain (Lee, 2013; Benchabane et al., 2018). Common kestrels are distributed mainly in the Eurasian continent and are classified as Least Concern (LC) on the IUCN Red List. However, in South Korea, the common kestrel has been designated and managed as a natural monument by the Cultural Heritage Administration (Cultural Heritage Administration, 2023).
Based on ecological characteristics, common kestrels are classified as resident or migratory birds according to region (Del Hoyo et al., 1994). They mainly live alone as diurnal species, but may also live in groups when food resources are abundant (Ferguson-Lees and Christie, 2001). Nesting locations in breeding areas vary and are commonly reported to be on rocky cliffs, buildings, and abandoned nests of Corvidae (Del Hoyo et al., 1994). Moreover, previous studies on common kestrels has been conducted on home range size (Damiani et al., 2022), nidification characteristics (Krueger Jr, 1998; Kübler, 2005), and reproductive success rates according to environmental conditions (Salvati, 2002). Research in the Republic of Korea include studies on distribution characteristics (Kim et al., 2019), food selection, behavioral characteristics (Kang et al., 2012), and breeding ecology of common kestrels, such as selection of nidification places (Won et al., 2005; Won et al., 2016) as well as their fledging out period and growth rates of chicks (Kang et al., 2012).
However, in South Korea, the common kestrel has been designated as a legally protected species, thus, there are research limitations in terms of obtaining permission to study them by observation monitoring, home-range analysis, and movement characteristics during the breeding season through accurate location tracking; therefore, studies on these aspects are insufficient. In this study, we aimed to provide fundamental data for urban biodiversity conservation management policies by analyzing the home-range and movement of common kestrels during their breeding season in Wonju-si, a small- to medium-sized city.
2. Materials and Methods
2.1. Study area
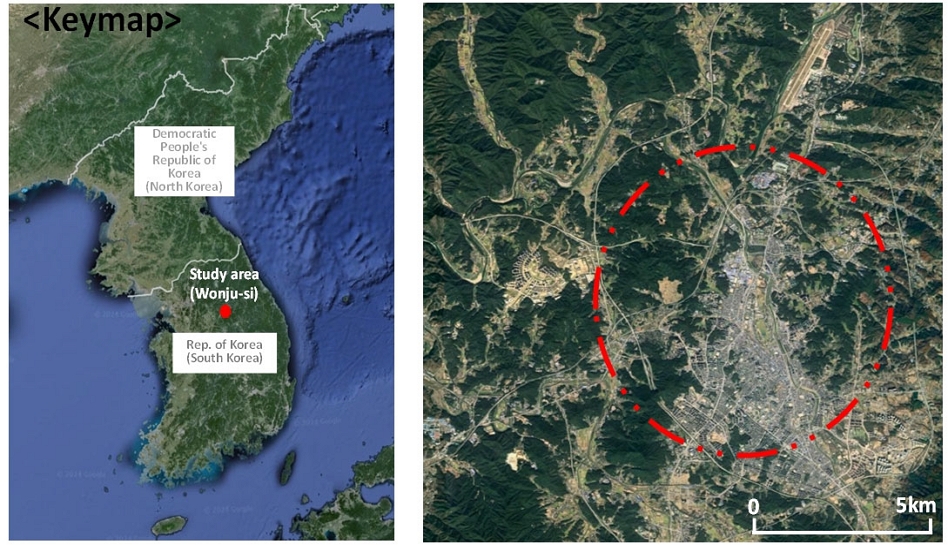
Wonju-si (37°23′18″N, 127°56′24″E) is a representative complex urban and rural city in South Korea and is located in the center of the Korean Peninsula (Fig. 1). It has a temperate central climate zone with an annual average temperature of 12.3℃(the coldest monthly average temperature in January is –3.7℃). The urban area is 868 ㎢, with a population of approximately 350,000 people. The main target areas for GPS monitoring were Usan-dong and Gahyeon-dong in Wonju-si, which have forests, agricultural lands, urbanized areas, and water bodies with various distributions around Wonjucheon.
2.2. Tracking and analysis method
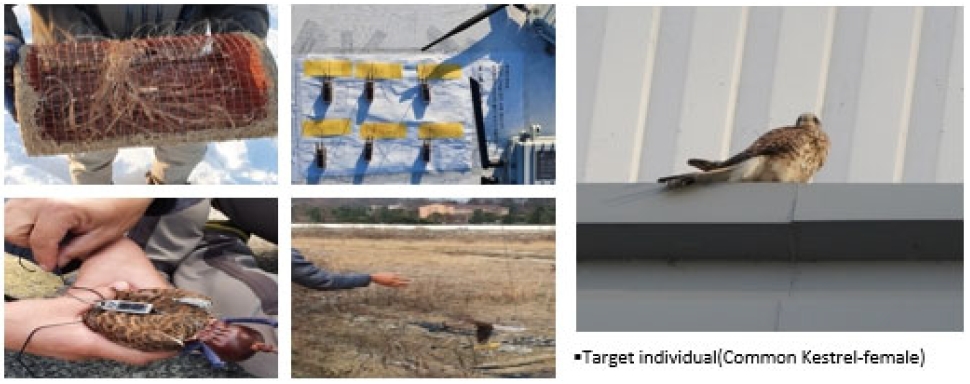
Investigation and analysis movement characteristics of the common kestrel were conducted based on previous distribution surveys, GPS tracking, and spatial and statistical analyses. The capture and attachment of GPS receivers was conducted with permission from the Cultural Heritage Administration because of the common kestrel’s natural monument status. Tracking and capturing of common kestrels were conducted in Usan-dong and Gahyeon-dong, Wonju-si. The birds were captured using a capture trap, a GPS receiver was then attached to each individual, and they were released after a sufficient rest period (Fig. 2). A 3 g Druid Nano tag GPS tracker (Druid Technology Co. Ltd., China) was used, which is less than 3% of the weight of the average common kestrel (216 g), as reported in a previous study (Kang et al., 2012), and was monitored using a domestic hub (3G) network with a gateway covering 1.5 ㎞.
The breeding period of common kestrels is from March to July (Won et al., 2005); therefore this study was conducted from 24 March to 15 July, 2022. The GPS receiver logged data at 2 h intervals (considering battery capacity) to interpret detailed movement patterns over the land at equal intervals. In addition, information such as altitude and flight speed were collected along with GPS information. In the spatial analysis stage of the home range, the minimum convex-hull polygon (MCP) and kernel density analyses were performed monthly using QGIS software (version 3.26). For the analysis of land-use characteristics over time, the spatial material of the land-use type (grassland, urbanized area, wetland, forest area, and farmland) was obtained from the Korean Ministry of Environment (Ministry of Environment, 2023). The distribution of tracking points during the study period was evaluated using R and SPSS software (version 26.0) for grouping and analyzing differences among groups. The percentages of fixed points according to the land-use type were standardized.
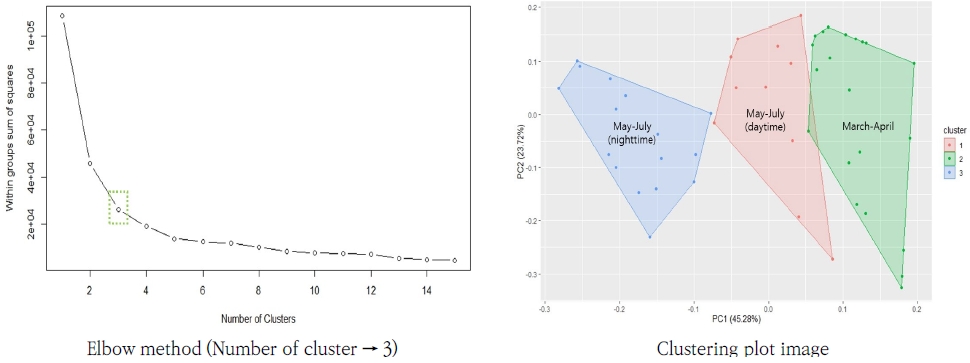
For grouping, K-means clustering was used, which groups data based on the cluster center point (centroid) closest to the data and maximizes data similarity in one cluster. To predetermine the number of clusters, the elbow method was used, which produces information for determining the best number of clusters by observing the percentage of the comparison between the number of clusters. Multivariate normality (MVN) was assessed using the “MVN” package in R, with significance set at p < 0.05. Because the normal distribution was not verified, the Kruskal–Wallis test, which is a nonparametric statistical test, was used to identify the difference among the groups. The Mann–Whitney U test was used to compare two groups.
3. Results and Discussion
3.1. Home-range analysis
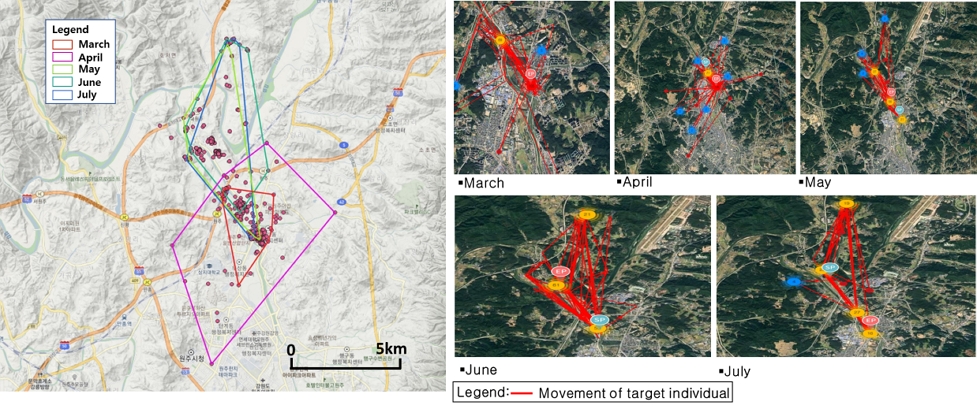
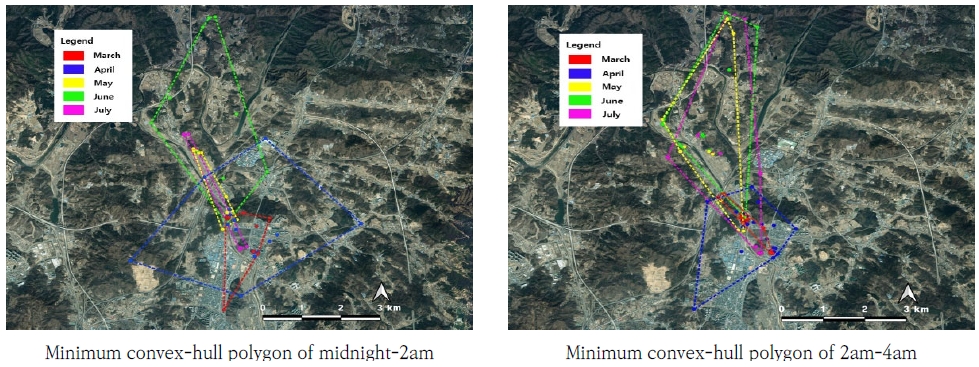
A total of 734 points were identified in March (144), April (237), May (119), June (135), and July (99). The movement area was analyzed using the MCP method on a monthly basis (March to July). The movement area was 4.17, 23.33, 9.53, 11.25, and 9.42 ㎢ in March, April, May, June, and July, respectively, with the smallest home-range in March, a sharp increase in active area in April, and a decrease again in May. The movement area between June and July was similar (Fig. 3).
The common kestrel showed the smallest home range in March because mating and egg brooding restricted the home range near the nest. The rapid increase in April was due to the increase in feeding activities of the chicks during their growth period, and the points of feeding activities were broadly distributed in the areas surrounding the nest. In May, the home range moved to a far-away area along the Seomgang River, which is a relatively large river; however, the common kestrel’s home range was relatively small because it moved only along the water body. According to Won et al.(2016), in May, when the feeding requirements of chicks rapidly increase, the use of the riverside increases because the common kestrels no longer use agricultural land as hunting grounds owing to the sowing of rice paddy fields. In June and July, the home range area did not change significantly because prey activity on the riverside and open spaces increased as they moved along the river. In a previous study based on the auto-correlated kernel density estimate (AKDE) in home-range analysis through GPS tracking of common kestrels in Italy (Damiani et al., 2022), the home range during the egg incubation stage was 1.11 ㎢, and that during the chick-rearing stage was 3.35 ㎢. In the present study, the home range was analyzed based on MCP analysis of individuals; thus, we could not definitively compare results with the above mentioned study, but the tendency to expand the movement area from the incubation stage to the chick-rearing period was clear.
According to the kernel density analysis (95%) based on appearance frequency, the frequency of use of forest areas was the highest at 37.9%, followed by urbanized areas (22.1%), grasslands (19.7%), farmlands (15.4%), and wetlands (4.8%) (Table 1). The percentage of agricultural land use was 15.4%, with most birds only using agricultural land in the early stage of breeding; thereafter the common kestrels used grasslands, bare lands, wetlands, and water bodies for feeding activities while moving along the nearby Seomgang River during the breeding season. According to the analysis of hunting behavior during the breeding season, prey activity in rivers and paddy fields are common in the early stages of breeding, and gradually increases along rivers (Won et al., 2016). Most agricultural lands, grasslands, bare lands, wetlands, and water bodies are believed to serve as feeding places. According to the kernel density analysis (50%) (Table 1), the frequency of use of urbanized areas was the highest, at 43.4%, followed by forests (27.2%), grasslands (15.8%), farmlands (10.6%), and wetlands (2.9%). We assumed that the nests were established in forests and urbanized areas, and that prey activity mainly occurred around rivers and on agricultural land in mid- to late-May, thus, common kestrels fledged out of urbanized areas and nested in forests. Rzępała et al.(2023) observed that the reproductive success rate of common kestrels was high in vacant lots with a small forest area. In addition, Kang et al.(2012) found that common kestrels use artificial structures, such as buildings, trees, pylons, and old nests of magpies, which is confirmed the fact that many GPS locations have been observed in forests (at night) and urbanized areas. Birds accidentally or intentionally choose the best place within their general habitat as a nesting location (Bruger, 1980). This is because it significantly influences their survival and reproductive success within limited environmental factors (Bruger and Gochfeld, 1988). Highly urbanized areas are believed to be occupied by common kestrels that are well adapted to the urban environment (Minor et al., 1993; Kang et al., 2012), and that they create nests in urbanized areas to lower the risk of predation (Village, 1998).
3.2. Analysis of movement behavior
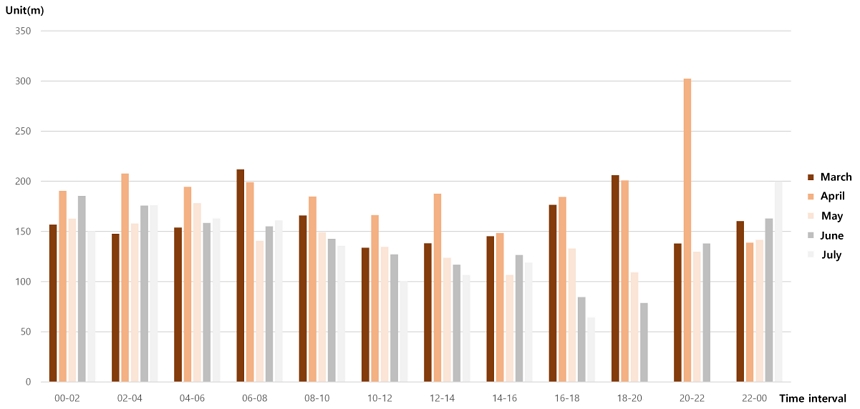
According to the flying altitude analysis results (Fig. 4), common kestrels fly at altitudes in the range of 4.9–618.1 m between March and July. Altitudes ranged from 21.1–342.7 m at 12–2 a.m., 28.3–562.9 m at 2–4 a.m., 57.5–375.9 m at 4–6 a.m., 67.4–618.1 m at 6–8 a.m., 73–347.3 m at 8–10 a.m., 4.9–319.9 m at 10 a.m. to 12 p.m., 18–265.4 m at 12–2 p.m., 31.8–222.8 m at 2–4 p.m., 21.2–232.2 m at 4–6 p.m., 29.2–273.7 m at 6–8 p.m., 106–302.4 m at 8–10 p.m., and 103.1–225.5 m at 10 p.m. to 12 a.m.. Therefore, clear changes in flight altitude were observed from late evening to dawn (8 p.m. to 6 a.m.), especially in April.
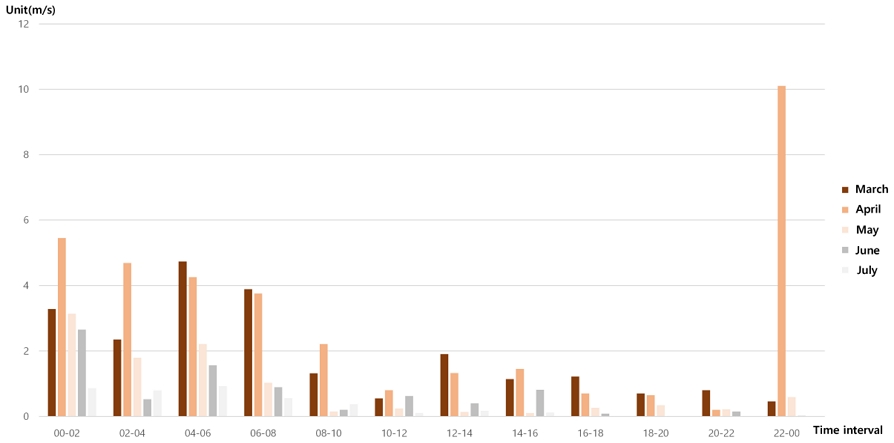
Regarding flight speed (Fig. 5), common kestrels showed a maximum flight speed of 21.4 m/s from 0 m/s (stop) at the stationary point. The flight speeds were from 0–16.5 m/s at 12–2 a.m., 0–21.4 m/s at 2–4 a.m., 0–20.5 m/s at 4–6 a.m., 0.1–17.4 m/s at 6–8 a.m., 0–17.7 m/s at 8–10 a.m., 0–10.8 m/s at 10 a.m. to 12 p.m., 0.1–7.2 m/s at 12–2 p.m., 0.1–4.4 m/s at 2–4 p.m., 0.3–3.6 m/s at 4–6 p.m., 0–1.4 m/s at 6–8 p.m., from 0.1–3.1 m/s at 8–10 p.m., and 0–10.1 m/s at 10 p.m. to 12 a.m. From the analysis results, the flight speed increased during the chick growth stage after the egg brooding stage, with flight speed clearly changing from late night to dawn (10 p.m. to 4 a.m.).
According to the MCP analysis results (Fig. 6) of the 12–4 a.m. period, considering the monthly increase in flight altitude and speed, the flight area from 12–2 a.m. was 1.84 ㎢ in March and 14.5 ㎢ in April. The flight area from 2–4 a.m. was 0.5 ㎢ in March and 4.9 ㎢ in April. This change in flight area was due a change in home range owing to fledging out.
Quantitative information on flight altitude and speed for the analysis of breeding season movement characteristics was gathered through GPS tracking, and we found that activity between 12 a.m. and 4 a.m. increased sharply in April compared with March. It was previously reported that the common kestrels diet comprised mostly small mammals (96.7%; Laboratorium and Groningen, 1988), with the main food source being rodents in South Korea (Won et al., 2016). Since most rodents are nocturnal, it is thought that common kestrels hunt at night, when there is relatively more rodent activity. Previous GPS and movement characteristic studies have limited data for late night activity owing to the battery constraints of small devices; therefore, identifying the movement characteristics of common kestrels during nighttime is important.
According the clustering analysis results (Fig. 7) to land use based on the monthly location data of the common kestrel’s movement, was divided into three groups using the elbow method. Group 1 (G1; n = 10 samples) confirmed the distribution of daytime locations from June to July; Group 2 (G2; n = 24 samples) confirmed the distribution of daytime and nighttime locations from March to April; and Group 3 (G3; n = 17 samples) confirmed the distribution of nighttime locations from June to July. In May, the locations of three groups were slightly mixed and could not be clearly distinguished.
According to the average location distribution by group considering land use, G1, G2, and G3 were distributed in grasslands at a rate of 13.10 ± 10.85%, 18.67 ± 9.23%, and 23.71 ± 13.72%, and distributed in urbanized/dried areas at a rate of 40.20 ± 12.00%, 71.00 ± 15.36%, and 10.06±10.98%, respectively. In the case of wetlands/water bodies, G1, G2, and G3 were distributed at rates of 45.30 ± 11.39%, 3.88 ± 5.91%, and 4.76 ± 7.55%, and distributed in forests at rates of 1.10 ± 3.48%, 4.13 ± 5.99%, 52.94 ± 23.27%, respectively. Finally, in the case of farmlands, G1, G2, and G3 were distributed at rates of 0.00 ± 0.00%, 2.33 ± 3.86%, and 8.18 ± 7.42%, respectively (Table 2).
According to the multivariate normality analysis (MVN), the data did not follow multivariate normality distribution at p < 0.05 based on the signal Mardia skewness (1.117) and Mardia Kurtosis (0.296). Therefore, the Kruskal–Wallis test results (Table 3) showed statistically significant differences among the groups in urbanized areas, wetlands/water bodies, forests, and farmlands. The Mann–Whitney U test results showed differences between G1 and G2, G1 and G3, and G2 and G3 in urbanized areas. In wetlands, significant differences were observed between G1 and G2 and G1 and G3. In forests, significant differences were observed between G1 and G3 and G2 and G3. In farmlands, a significant difference was observed between G2 and G3.
The cluster analysis, and Kruskal–Wallis and Mann–Whitney U tests based on the monthly period (2 h intervals) and land-use type, confirmed that the movement of common kestrels were highest in March to April, May to July (daytime) and May to July (nighttime), and the difference in land use, except for grasslands, among the groups was significant.
4. Conclusions
This study analyzed the characteristics of the breeding behavior of common kestrels living in South Korea using GPS tracking. Our findings provide quantitative analysis results on the formation of monthly home ranges and land-use characteristics for systematic habitat management of common kestrels adapted to urban environments.
Because common kestrels are registered as a natural monument in South Korea, acquiring ethical clearance to study them is difficult; therefore, GPS-based research on common kestrels in the existing South Korean urban environment is limited. The quantitative values and movement characteristics observed in this study can be used in future habitat conservation policies for common kestrels.
The reproductive behavior of common kestrels has been confirmed in previous studies, and it was shown that their home ranges are restricted near the nest during mating and egg brooding, but the radius expands rapidly in April. Based on the analysis of analyzing flight altitude, speed, and movement radius, activities from late night to dawn also increased. In addition, according to the statistical analysis results of land use on a monthly basis, analyzing whether there are differences in land-use characteristics according to the groups (March-April, May-July [daytime], and May-July [nighttime]) is also important. However, this study has one limitation; only one female common kestrel was captured, thus, the population was not well represented, producing a shortage of inference. Therefore, further GPS-based monitoring related to the movement characteristics of both males and females is required. In addition, further research is required to determine whether frequent movement of common kestrels from late night to early morning hours is a behavioral adaptation to avoid natural enemies, such as nocturnal birds of prey, or light pollution.
Acknowledgments
This work was supported by the National Research Foundation of Korea(NRF) grant funded by the Korea government(MSIT) (No. 2020R1G1A1101119).
REFERENCES
- Benchabane, S., Bensaci, E., Nouidjem, Y., Bougoudjil, S., Menouar, S., 2018, Structure and diversity pattern of urban birds in semi-arid region of Algeria, World J. Environ. Biosci., 7, 40-47.
- Burger, J., 1980, Nesting adaptations of Herring Gulls (Larus argentatus) to salt marshes, and storm tides, Biol. Behav, 5, 147-162.
-
Burger, J., Gochfeld, M., 1988, Nest site selection and temporal patterns in habitat use of Roseate and Common Terns, The Auk, 105, 433-438.
[https://doi.org/10.1093/auk/105.3.433]

- Convention on Biological Diversity, 2021, https://www.cbd.int, .
- Convention on Biological Diversity, 2020, Global Biodiversity Outlook 5, Montreal, Canada.
- Cultural Heritage Administration, 2024, https://www.heritage.go.kr, .
- Damiani, G., Jennings, V., Dell'Omo, G., Costantini, D., 2022, GPS-tracking reveals annual variation in home-range and sedentary behaviour in Common Kestrels breeding in central Italy, Avocetta, 46, 87-96.
- Del Hoyo, J., Elliot, A., Sargatal, J., 1994, Handbook of the birds of the world, 2nd ed., Lynx Edicions, Barcelona, 1-21.
- Ferguson-Lees, J., Christie, D. A., 2001, Raptors of the world, 1st ed., Houghton Mifflin Company, New York, 264-265.
- Kang, S. G., Hur, W. H., Lee, I. S., 2012, Seasonal prey selection and behavior characteristics of Common Kestrel (Falco tinnunculus) in suburban area in Busan Korea, Kor. J. Orni., 19, 53-63.
- Kang, S. G., Hur, W. H., Lee, I. S., 2012, Fledging period, types of structure supporting nests and growth rate for fledglings of Common Kestrel (Falco tinnunculus) in urban area, Kor. J. Orni., 19, 173-183.
- Kim, W. Y., Kim, S. H., Park, J. C., Jung, S. G., Bing, G. C., 2019, A Ten-year(’08~’17) study on the distribution of the Common Kestrel, Korean Journal of Cultural Heritage Studies, 52, 82-89.
- Krueger Jr., T. E., 1998, The use of electrical transmission pylons as nesting sites by the Kestrel Falco tinnunculusin North-East Italy, Holarctic Birds of Prey, ADENEX-WWGBP, Extremadura, 141-148.
-
Kübler, S., Kupko, S., Zeller, U., 2005, The Kestrel (Falco tinnunculus) in Berlin: Investigation of breeding biology and feeding ecology, J. Ornithol., 146, 271-278.
[https://doi.org/10.1007/s10336-005-0089-2]

-
Laboratorium, Z., Groningen, R., 1988, Time allocation in the kestrel (Falco tinnunculus), and the principle of energy minimization, J. Anim. Ecol., 57, 411-432.
[https://doi.org/10.2307/4914]

-
Lee, S., 2013, Distribution and abundance of wintering raptors in the Korean peninsula, J. Ecol. Environ., 36, 211-216.
[https://doi.org/10.5141/ecoenv.2013.211]

- Ministry of Environment, 2023, https://egis.me.go.kr, .
- Minor, W., Minor, F. M., Ingraldi, M. F., 1993, Nesting of Red-tailed Hawks and Great-horned Owls in a Central New York urban/suburban area, J. Field Ornithol., 64, 433-439.
-
Pettorelli, N., Laurance, W. F., O'brien, T. G., Wegmann, M., Nagendra, H., Turner, W., 2014, Satellite remote sensing for applied ecologists: Opportunities and challenges, J. Appl. Ecol., 51, 839–848.
[https://doi.org/10.1111/1365-2664.12261]

-
Rzępała, M., Kasprzykowski, Z., Obłoza, P., Mitrus, C., Golawski, A., 2023, The influence of habitat and the location of nest-boxes on the occupation of boxes and breeding success of the Kestrel Falco tinnunculus, Eur. Zool. J., 90, 1-9.
[https://doi.org/10.1080/24750263.2022.2152504]

- Salvati, L., 2002, Spring weather and breeding success of Eurasian Kestrel (Falco tinnunculus) in urban Rome, Italy, J. Raptor Res., 36, 81-84.
- Village, A., 1998, Falco tinnunculus Kestrel, BWP update, 2, 121-136.
-
Vitousek, P., Mooney, H., Lubchenco, J., Melillo, J., 1997, Human domination of earth's eco systems, J. Sci., 277, 494–499.
[https://doi.org/10.1126/science.277.5325.494]

- Won, I. J., Cho, S. R., Baek, C. Y., 2005, The study on breeding ecology of Common Kestrels (Falco tinnunculus), Kor. J. Orni., 12, 61-68.
-
Won, I. J., Park, M. C., Park, H. D., Cho, S. R., 2016, A Study on select of common Kestrel (Falco tinnunculus) hunting areas in breeding session, Journal of Wetlands Research, 18, 350-356.
[https://doi.org/10.17663/JWR.2016.18.4.350]

Department of Environmental Landscape Architecture, Gangneung-Wonju National University zelkovayeum@gwnu.ac.kr
Wildlife Ecological Conservation Instituteyijinh@naver.com
Gyeongsangnamdo Environment Foundationthisplus0414@naver.com
