
희토류 이온(Ce, Gd)의 농도 수준에 따른 옥수수 발아 및 초기 생장 특성 분석
Ⓒ The Korean Environmental Sciences Society. All rights reserved.
This is an Open-Access article distributed under the terms of the Creative Commons Attribution Non-Commercial License (http://creativecommons.org/licenses/by-nc/3.0) which permits unrestricted non-commercial use, distribution, and reproduction in any medium, provided the original work is properly cited.
Abstract
In this study, the effects of cerium (Ce) and gadolinium (Gd) treatments (0.1–1 mM) on the germination and early growth of maize (Zea mays L.) seeds were evaluated. Neither element impaired germination vigor; however, there were distinct tissue-specific sensitivities were during seedling growth. High concentrations of both elements severely inhibited radicle elongation and surface area, whereas the plumule was unaffected. Inductively coupled plasma and malondialdehyde analyses showed that tissue accumulation of both elements increased in a concentration-dependent manner. However, malondialdehyde levels spiked exclusively under high-concentration Gd treatments. This indicates that Gd induces direct oxidative stress via lipid peroxidation, whereas Ce triggers physiological inhibition through mechanisms other than structural membrane damage. Overall, by clarifying the distinct toxicological mechanisms of these rare earth elements, foundational data has been provided for establishing safe management criteria in agricultural ecosystems, and in the evaluation of soil pollution.
Keywords:
Cerium, Gadolinium, Maize (Zea mays L.), Rare earth elements, Root system architecture (RSA), Seedling growth1. 서 론
희토류 원소(rare earth elements, REE)는 고유의 자기적·광학적 및 화학적 안정성을 바탕으로 전기·하이브리드 자동차, 풍력 발전, 디스플레이 등 첨단 하이테크 산업 전반의 핵심 소재로 광범위하게 활용되어 왔다(Haxel, 2002; Liu et al., 2021). 디지털 장비 제조 분야의 수요 급증으로 인해 세계 희토류 채굴량은 급격히 증가하는 추세이다(Chen, 2011; Stein et al., 2022). 또한 농업 분야에서는 중국을 중심으로 2000년대 초부터 400만 헥타르 이상의 농경지에 희토류 함유 비료를 시용하여 옥수수, 벼, 밀 등의 작물 생산성 향상 및 가축 사료용 작물 재배에 적용된 바 있다(Liang et al., 2005). 반면, 국내의 경우 희토류 원소가 비료 공정 규격에 등록되어 있지 않아 농업적 시용이 제한되며, 의료 폐수 내 가돌리늄(Gd)의 수생태계 유출(Bau et al., 2006)이나 전자폐기물 등에 의해 유입되는 인위적 오염물질로 분류된다(Stein et al., 2022). 이에 따라 광산 및 정유공장 주변 지역뿐만 아니라, 희토류 비료가 지속적으로 시용된 농경지 토양에서도 비정상적인 축적 현상이 보고되고 있다(Wang et al., 1997; França et al., 2002). 과거 희토류는 인축에 독성이 없는 것으로 인식되었으나(Schwabe et al., 2012), 최근 연구에 따르면 토양 내 희토류의 장기 체류는 먹이사슬 전반에서 생물 축적(bioaccumulation)을 유도하여 잠재적인 위험성을 갖는 것으로 보고되었다(Yuan et al., 2018).
최근 생물학에서 저용량에서 생육을 자극하고 고용량에서 이를 억제하는 이중상 용량-반응 현상인 호르메시스(Hormesis)의 광범위한 보편성이 입증되고 있으며(Calabrese et al., 2017), 식물 역시 희토류 노출 조건에서 세포 및 유기체 수준의 호르메시스 반응이 보고된 바 있다(Belz and Piepho, 2015). 그러나 호르메시스 자극 효과는 농도 의존적 범위가 극도로 협소하여, 미세한 용량 편차에 의해서도 식물 독성(phytotoxicity)을 유발하는 높은 불확실성을 내포하고 있다(Calabrese et al., 2010). 특히 식물의 초기 생육 단계 중 유묘의 뿌리는 희토류의 호르메시스 반응 및 잠재적 독성을 판별하는 가장 민감하고 직관적인 지표이다(Brioschi et al., 2013). 희토류 원소가 뿌리에 미치는 영향은 측근(lateral root)의 발달, 표면적 등 뿌리계 구조(root system architecture, RSA) 전반의 형태학적 재배치를 동반하므로, 고해상도 디지털 이미지 기반의 정밀한 RSA 분석은 기존 달관 조사의 한계를 보완할 수 있다(Mohamed et al., 2017).
옥수수(Zea mays L.)는 국내 밭작물 재배면적 상위를 차지하는 대표적인 식량 및 사료작물이자, 환경 스트레스에 대해 비교적 높은 생리적 내성을 지닌 작물이다. 특히 옥수수는 초기 생육 속도가 빠르고 균일하여 희토류 원소 노출에 따른 뿌리 계 구조 분석 및 생리적 가소성을 규명하기에 적합하므로 공시 작물로 선정하였다.
이에 본 연구에서는 희토류(Ce, Gd) 처리에 따른 옥수수 초기 유묘의 특성을 확인하고, ImageJ의 SmartRoot 플러그인을 활용하여 총 뿌리 길이, 표면적, 디지털 부피 등 초기 뿌리계 구조의 형태학적 변화를 추적하였다. 또한 세포막 지질과산화 지표인 MDA 함량 분석을 통해 농도별 산화 스트레스의 유발 경계를 구명하고 옥수수 종자(seed), 유근(radicle) 및 유아(plumule) 조직 내부의 REE 축적량 및 주요 필수 양이온의 분획 양상을 추적하였다. 이를 통해 REE가 옥수수 초기 생장 및 무기 영양소 균형에 미치는 생리학적 영향과 호르메시스 발현을 확인함으로써, 향후 희토류의 농업적 리스크 관리와 안전 수준 설정을 위한 기초 자료를 제공하고자 한다.
2. 재료 및 방법
2.1. 공시 재료 및 실험 조건 설정
본 연구의 공시 작물로는 옥수수 품종인 '스피드대학찰 1호'(Jeilseed, Korea)를 사용하였다. 실험을 위해 건전한 종자 60 립씩을 선별하여 200 mL 비커에 넣고, 1% 차아염소산나트륨 수용액(sodium hypochlorite, Junsei Chemical, Japan)에 10 분간 침지하여 종자 표면을 살균하였다. 살균 후 종자 표면에 잔류하는 차아염소산을 제거하기 위해 증류수로 5 회 이상 세척하였다.
종자의 균일한 발아를 유도하기 위해, 살균된 종자를 각 처리 용액에 완전히 잠기도록 하여 6 시간 동안 침지하는 프라이밍(priming) 처리를 수행하였다. 침지 과정 중에는 종자에 신선한 공기를 원활히 공급하고자 1 시간 간격으로 유리막대를 이용하여 완만하게 교반하였다. 프라이밍 처리가 완료된 종자는 100 × 15 mm Petri dish (SPL Life Sciences, Korea)에 여과지(filter paper, HYUNDAI Micro, Korea) 2장을 깐 후, 각 처리 용액 10 mL를 관주하여 충분히 젖은 상태에서 치상하였다. 이때 통계 분석의 신뢰성을 확보하기 위하여 처리당 총 60 립의 종자를 petri dish당 10 립씩 6 반복으로 나누어 배치하였다. 생육 온도는 28℃, 광주기는 12시간 간격(light/dark = 12/12 hours)으로 조절된 항온배양기(HB-302LP, Hanbaek Scientific, Korea)에서 발아 및 생육을 유도하였다.
실험에 사용된 희토류 원소 시약은 질산세륨 육수화물[Ce(NO3)3·6H2O] (Duksan GR grade, Korea)과 질산가돌리늄 육수화물[Gd(NO3)3·6H2O](Samchun Pure Chemical, Korea)을 사용하였다. 희토류 용액에 포함된 질산염(NO3-)이 옥수수 종자의 발아 및 초기 유근 성장에 미치는 독자적인 영향을 배제하고 3가 양이온만의 순수한 효과를 분리하기 위하여, 희토류 최대 처리 농도(1 mM)의 질산염 당량과 동일한 3 mM의 질산칼륨(KNO3) 용액을 이온 대조군(ionic control)으로 설정하였다. 모든 실험 용액은 각 성분의 최고 농도 용액을 조제한 후, 이를 모용액(stock solution)으로 삼아 단계적으로 희석하여 사용하였으며, 구체적인 실험 처리구의 조성, 투여량, 그리고 조제된 용액의 이화학적 특성(pH, EC)은 다음과 같다(Table 1).

Experimental treatments, molar concentrations, and application amounts of rare earth elements (Ce, Gd) and the ionic control
2.2. 옥수수 종자의 발아 특성 및 초기 뿌리 형태 분석
발아 조사는 종자 치상 후 12 시간 간격으로 실시하였으며, 국제종자검정협회(International Seed Testing Association, ISTA)의 규정에 준하여 유근이 최소 1 mm 이상 돌출된 것을 발아로 정의하였다. 희토류 처리에 따른 옥수수 종자의 발아 특성을 비교하기 위해, 치상 후 조사된 누적 데이터를 바탕으로 최종 발아율(final germination percentage, %), 발아 속도 지수(germination speed index), 평균 발아 시간(T50, hours) 및 발아 동기화 지수(synchronization index) 등의 발아 활력 지표를 산출하였다(Table 2).
Evaluation formulas for seed germination indices of maize
치상 후 2일차부터 각 처리구별 옥수수 유묘를 무작위로 5개체씩 선발하여 유근과 유아의 표현형 분석을 수행하였다. petri dish에서 채취한 유묘는 이미지 왜곡을 방지하기 위하여 초순수가 담긴 용기 내에서 완만하게 흔들어 세척하였으며, 핀셋을 이용하여 유근이 겹치지 않도록 촬영용 petri dish 위에 균일하게 전개하였다. 영상 데이터의 객관성과 재현성을 확보하기 위해 외부 광원이 차단된 암실 조건의 LED 포토박스(RM-PB4840, RAMI, Korea) 내에서 동일한 광량으로 스마트폰(Galaxy S24 Ultra, Samsung Electronics, Korea)의 내장 카메라를 활용하여 동일한 거리(30 cm)에서 수직으로 고해상도 디지털 이미지를 촬영하였다.
수집된 뿌리 이미지는 ImageJ (v. 1.53; Schneider et al., 2012) 소프트웨어의 플러그인인 SmartRoot (v. 4.1)를 활용하여 Fig. 1의 분석 프로세스에 따라 정량화하였다. 정밀한 뿌리 추적을 위하여 촬영된 원본 RGB 이미지는 8-bit grayscale 이미지로 변환하였으며(Fig. 1-B), 배경과 뿌리의 경계를 명확히 분리하고자 밝기(brightness) 및 대비(contrast)를 auto 기능을 활용하여 최적화하는 전처리 과정을 거쳤다. 이후 petri dish의 실제 지름(100 mm)을 기준으로 소프트웨어 내에서 픽셀 단위를 실제 거리 단위로 변환하는 공간 보정(pixel-to-millimeter calibration)을 수행하였다(Fig. 1-C). 보정된 이미지 상에서 유근 및 측근을 형태학적으로 추적·분석하였으며(Fig. 1-D), 최종적으로 petri dish 지름과 연계된 픽셀 스케일을 기반으로 총 뿌리 길이, 표면적 및 부피 등을 자동 산출하였다(Fig. 1-E).
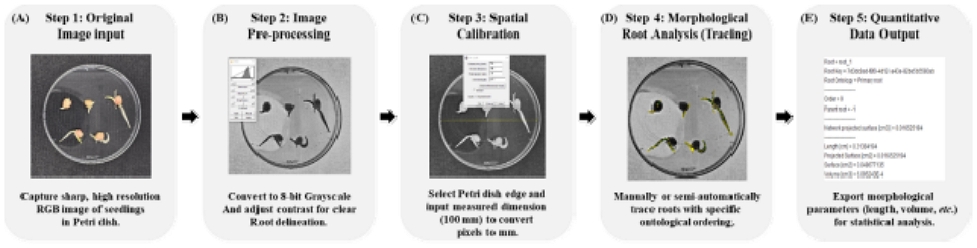
Workflow of semi-automated root morphological analysis using SmartRoot software (v. 4.1). (A) Original RGB image of seedlings in a Petri dish. (B) Image pre-processing: conversion to 8-bit grayscale and optimization of brightness/contrast for root delineation. (C) Spatial calibration based on the Petri dish diameter (100 mm) to convert pixels to distance units. (D) Semi-automated tracing of primary and lateral roots on the calibrated image. (E) Representative output of vectorized root system and quantitative morphological data.
2.3. 세포막 지질과산화(MDA) 및 희토류 원소 함량 정량 분석
희토류 원소 처리가 옥수수 유묘 조직의 산화 스트레스(oxidative stress) 유발 및 세포막 지질과산화(lipid peroxidation) 정도를 평가하고자, Heath and Packer (1968)의 방법을 적용하여 Malondialdehyde (MDA) 함량을 분석하였다. 처리구별 옥수수 종자의 유근과 유아 조직을 각각 분리한 후 생체중(0.2 ± 0.02 g)을 정량하여 0.1% trichloroacetic acid (TCA, Junsei Chemical, Japan)용액 5 mL와 함께 ice-bath상에서 균질하게 마쇄하였다. 마쇄된 시료는 4℃ 조건하에서 10,000 × g로 20분간 원심분리를 수행하였다. 원심분리 후 수집된 상등액 1 mL에 20% TCA와 0.5% thiobarbituric acid (TBA, RHAWN, China)가 혼합된 반응액 2 mL를 첨가하고 교반하였다. 혼합액은 95℃의 항온수조에서 30분간 가열하여 발색 반응을 유도하였으며, 가열 직후 얼음에 침지하여 반응을 종료시켰다. 냉각된 반응액을 다시 10,000 × g에서 10분간 원심분리한 후, 최종 상등액을 UV-VIS 분광광도계(T-60 UV-VIS Spectrophotometer, PG Instruments, USA)를 사용하여 532 nm 및 600 nm 파장에서 흡광도를 측정하였다. 조직 내 MDA 함량은 아래의 공식을 활용하여 산출하였다.
- FW: Fresh Weight : Supernatant + mixed solution(3 mL) : Supernatant(1 mL) : Extract solution(5 mL)
희토류 처리에 따른 옥수수 조직 내 주요 필수 양이온의 함량 변화와 희토류의 체내 이행 특성을 구명하기 위해 무기 원소 정량 분석을 실시하였다. 분석 시 뿌리 및 종자 표면에 물리적으로 흡착된 희토류 이온을 제거하고 조직 내부로 흡수된 실제 이행량만을 정량화하기 위하여, 수확한 유묘를 대상으로 전처리 세척 과정을 수행하였다. 채취한 옥수수 유묘는 1차적으로 증류수로 세척한 후, 세포벽 및 표면에 결합된 희토류 이온을 탈착시키기 위해 킬레이트제인 1 mM ethylenediaminetetraacetic acid (EDTA, 99.0%, GR grade, Korea) 용액으로 세척하여 표면 성분을 제거하고 증류수로 재세척하였다.
세척이 완료된 시료는 60℃ 열풍건조기에서 48시간 이상 완전히 건조시켰다. 이때 유묘 초기 단계의 제한된 건조중량(dry weight)으로 인해, ICP 분석에 필요한 최소 시료량을 확보하고자 동일 처리구 내 반복구의 조직(유근, 유아)들을 각각 혼합하여 분석 시료로 사용하였다. 혼합된 조직을 초자에 넣고 70% 질산(HNO3) 5 mL와 과산화수소(H2O2) 1 mL를 가한 후, 블록다이제스터(block digester)를 이용하여 여액이 투명해질 때까지 습식 열분해를 수행하였다. 분해가 완료된 시료는 초순수로 희석한 후, 0.45 μm PTFE 주사기 필터(Millex-LH hydrophilic PTFE syringe filter, Merck Millipore, Germany)로 여과하여 ICP-OES (Agilent 5800 ICP-OES, Agilent Technologies, USA)를 활용해 주요 필수 양이온(Ca2+, K+, Mg2+)과 희토류 원소(Ce3+, Gd3+)를 정량 분석하였다.
2.4. 통계 처리 및 데이터 분석
희토류 원소(Ce, Gd)의 처리 농도 및 처리 일수(Days after treatment, DAT)가 옥수수 유묘의 생장과 생리적 반응에 미치는 영향을 검정하기 위해 통계 분석 소프트웨어인 R (v. 4.2.1, R Core Team, 2022)을 활용하여 통계 분석을 수행하였다. 옥수수 종자의 발아 지표, 조직별 MDA 함량, 일별 처리 간의 생장 반응은 일원배치 분산분석(one-way ANOVA)으로 검정하였다. 한편, 발아 이후 시계열별로 측정된 뿌리의 형태학적 파라미터의 변동을 분석하고 처리 요인, 시간 요인 그리고 두 요인 간의 상호작용 효과를 검증하고자 이원배치 분산분석(two-way ANOVA)으로 실시하였다. 분산분석 결과 통계적으로 유의미한 차이가 인정되는 경우, p < 0.05 수준에서 Duncan의 다중검정(Duncan’s multiple range test)을 실시하여 평균 간의 유의성을 비교 분석하였다.
3. 결과 및 고찰
3.1. 희토류 이온 처리에 따른 옥수수 종자의 발아 특성 및 초기 활력 평가
다양한 농도의 희토류 이온(Ce, Gd) 및 KNO3 처리가 옥수수 종자의 발아율에 미치는 영향을 조사한 결과, 모든 처리구에서 대조구 대비 발아율의 통계적으로 유의미한 차이가 확인되지 않았다(Table 3). 최종 발아율은 모든 처리구에서 70% 이상을 유지하였으며, 일부 고농도 처리구에서 발아율이 다소 낮아지는 경향이 관찰되었으나, 이러한 변화는 통계적으로 유의하지 않았다. 이러한 결과는 본 논문에서 적용한 농도 범위(0.1–1 mM)의 희토류 이온이 옥수수 종자의 초기 발아 과정에서 유의한 저해 효과를 나타내지 않았음을 시사한다.
Effects of rare earth ion treatments on germination characteristics of maize seeds
종자의 발아속도와 활력을 정밀하게 평가하기 위해 발아 활력 지수를 계산하여 활용하였다. 발아 속도 지수는 종자들이 얼마만큼 빠르게 발아했는가를 평가하는 지수로 대조구와 비교하여 이온 처리구 간의 차이가 발생하지 않은 것으로 보아 희토류 이온 처리가 종자의 발아 속도를 지연시키지 않았음을 확인할 수 있었다. 이를 뒷받침하듯 전체 종자의 50%가 발아하는 데 소요된 시간(T50) 또한 31.5–34.1 시간의 범위로 처리구 간에 매우 유사한 경향을 나타냈다.
개체 및 반복 간 발아의 균일도를 평가하는 발아 동기화 지수 또한 처리구 간 통계적으로 유의한 차이가 없었다. 일부 처리구 간의 증감이 확인되었지만, 희토류 이온의 종류 또는 농도 증가에 따른 경향성은 확인되지 않았다. 따라서 발아 활력 지수들을 종합적으로 분석해 보면 본 연구에서 사용한 Ce과 Gd 처리는 옥수수 종자의 발아 단계에서 유의한 생리적 스트레스를 유발하지 않은 것으로 판단된다.
기존 연구에 따르면 희토류 처리는 노화된 종자의 발아력과 초기 생육을 촉진하는 것으로 보고되었다. 벼 종자에서 Ce(NO3)3 10–15 mg/kg 처리, 그리고 대두와 해바라기 종자에서의 Ce 및 Gd을 포함한 복합 희토류 0.2% 처리에서 효과가 확인되었다(Bai et al., 1988; Fashui, 2002). 반면, 듀럼밀에서는 본 연구의 농도와 유사하게 La(NO3)3 침지 조건(0.01–0.1 mM, 8 hours, 1–10 mM, 2–4 hours)을 설정하였음에도 발아율이 감소하였으며, 옥수수와 녹두의 경우 La 및 Ce 0.1 mg/kg 수준에서는 반응이 없었으나, 2 mg/kg 이상에서는 건중량이 감소하였다(Diatloff et al., 2008; d’Aquino et al., 2009). 연구 결과를 종합해보면 희토류가 종자의 발아에 미치는 영향은 고정된 것이 아니라, 처리된 원소의 종류와 농도, 대상 식물의 종, 실험 환경 조건 등에 따라 반응 없음, 자극 또는 억제 효과로 다양하게 나타날 수 있다고 보고되었다. 본 연구에서 사용한 Ce과 Gd 농도는 옥수수 종자가 발아 스트레스를 받지 않는 안전 농도 범위 내에 있었던 것으로 해석된다.
이온 대조군으로 설정한 3 mM KNO3 처리구 역시 대조구와 유의한 차이가 나타나지 않았다. 선행연구 결과, 3 mM KNO3 보다 훨씬 고농도에서도 종자의 활력이 저해되지 않으며, 스트레스 내성 증대, 프라이밍 효과 등 긍정적인 효과가 있는 것으로 보고되어 질산 이온 자체는 옥수수 종자의 발아 과정에 부정적인 영향을 미치지 않았음을 확인할 수 있었다(Anosheh et al., 2011; Nawaz et al., 2017).
3.2. 희토류 이온 처리에 따른 옥수수 유묘의 유아 및 유근의 형태학적 생장 분석
본 연구에서 설정한 농도 범위의 희토류 이온(Ce, Gd) 처리가 발아 이후 옥수수 유묘의 유아 및 유근의 형태학적 생장에 미치는 시간별 영향을 분석하고자 각 시점별로 일원배치 분산분석을 실시하였으며, 그 결과는 Table 4와 같다. 또한 희토류 처리 효과, 시간 경과, 그리고 두 요인 간의 상호작용을 통합적으로 검정하기 위해 이원배치 분산분석(Two-way ANOVA)을 수행한 결과, 유근과 관련된 지표(총 유근 길이, 가장 긴 유근 길이, 총 뿌리 표면적)들은 처리 요인, 시간 요인, 그리고 두 요인 간의 상호작용 효과 모두에서 유의미한 결과가 확인되었다(Table 5).
Effects of rare earth ion treatments on the morphological growth characteristics of maize plumule and radicle
Two-way analysis of variance (ANOVA) for the morphological growth parameters of maize seedlings
특히 저농도(0.1 mM)의 Ce과 Gd 처리구에서는 DAT 4 기준 총 유근 길이가 각각 18.59 mm, 15.27 mm로 대조구(13.66 mm)를 상회하여 저농도 자극 효과를 보였다(Table 4). 그러나 농도가 0.5 mM 이상으로 증가함에 따라 유근의 신장이 억제되기 시작하였고 1 mM 처리구의 경우 DAT 2에서는 대조구와의 차이가 없었으나, DAT 4에서는 절반 수준으로 감소하여 유근의 신장이 크게 억제되어 호르메시스 반응을 보였다. 이러한 경향은 가장 긴 유근 길이와 총 뿌리 표면적에서도 동일하게 관찰되었다.
반면, 유아의 성장은 시간 요인에 의해서만 유의미한 영향이 있었을 뿐 처리 농도 및 상호작용 효과는 유의미하지 않았다. DAT 4의 유아 길이를 비교해보면 대조구의 유아 길이(2.48 mm)와 최고 농도(1 mM)인 Ce(2.68 mm) 및 Gd(2.27 mm) 처리구 간에 뚜렷한 생장 저해는 관찰되지 않아, 초기 발아 단계의 옥수수 유아는 희토류 이온 노출에 대해 상대적으로 둔감한 것으로 확인되었다.
이러한 부위별 민감도 차이는 희토류 원소의 식물체 내 이동 특성과 밀접한 관련이 있다. 유근은 배지 내 희토류 이온과 접촉하는 1차 기관으로 농도 변화에 즉각적이고 민감하게 반응하였다. 반면, 유아는 통도 조직을 거쳐야 하는데 희토류 이온은 일반적으로 세포벽과 카스파리대(Casparian strip) 등에 걸러져 지상부의 전이 계수가 낮은 것으로 보고되고 있다(Shan et al., 2003; Brioschi et al., 2013). 옥수수 유묘를 대상으로 La를 처리한 선행 연구에서도 처리 용액의 농도가 증가함에 따라 지상부보다 지하부에 희토류의 축적이 우세하게 나타났다. 또한, 지하부의 생육 억제를 유발하는 용액의 독성 임계 농도(약 0.36 mM)가 지상부(약 5.40 mM)보다 현저히 낮아 뿌리가 훨씬 민감한 것으로 보고되었다(Xin et al., 2006). 이는 지상부 조직 자체의 내성이라고 하기보다는 뿌리 표피 및 세포벽에 대한 희토류의 결합 및 통도 조직을 통한 지상부 이행 제한으로 판단된다. 따라서 본 연구의 Petri dish 환경 내 시험이라는 한계점은 존재하나, 0.5 mM 이상 처리구에서 유근은 직접적인 독성 스트레스를 받아 신장이 억제된 반면, 유아는 체내 이동 제한으로 유의미한 저해가 관찰되지 않은 것으로 해석된다.
3.3. 옥수수 유묘의 희토류 이온 흡수 및 지질 과산화도(MDA) 분석
희토류 이온 처리가 옥수수 초기 유묘의 세포막 손상 및 이온 흡수 기전에 미치는 영향을 규명하고자, MDA 함량과 ICP-OES를 통한 체내 원소 축적량을 분석하였다(Table 6, Table 7). 무기 원소 분석(ICP)은 앞서 언급한 바와 같이 초기 유묘 단계의 제한된 건조중량으로 인해 유아와 유근을 섞어 단일 반복 분석으로 실시하였다. 처리 농도(0.1 mM → 1 mM)가 증가함에 따라 식물체 내 Ce 함량(64.0 → 1,102.3 mg/kg)과 Gd 함량(70.7 → 1,345 mg/kg) 모두 급격히 증가하는 농도 의존적 흡수 경향이 확인되었다(Table 6).
Mineral element and rare earth element (Ce, Gd) concentrations in tissues of maize seedlings
Effects of rare earth elements (Ce, Gd) on MDA content in radicle and plumule of maize seedlings
일반적으로 희토류 원소와 주요 양이온(Ca2+, K+, Mg2+)은 식물 체내에서 경쟁적인 길항 작용을 하며, 희토류 원소 상호 간에도 이온 반경과 전하 특성 등에 따라 흡착 및 흡수 과정에서 우선순위가 발생하는 분별 현상이 나타나는 것으로 알려져 있다(Hu et al., 2004; Liang et al., 2008). 그러나 본 연구에서는 KNO3 처리구를 포함한 질산염(NO3-)기반의 희토류 처리구에서 대조구 대비 칼슘은 약 2배, 칼륨과 마그네슘은 약 4배 높은 함량을 보였다.
외부 양이온 유입이 차단된 초순수 조건임을 고려할 때, 이러한 양이온 농도의 일률적 증가는 음이온인 NO3- 흡수 및 체내 이행 과정에 따른 식물의 이온 항상성 조절 기작으로 설명된다(Kirkby and Knight, 1977; Van Beusichem et al., 1988). 식물은 음이온인 질산염을 흡수할 때 체내 전기적 중성을 유지하고 양성자 구동력을 조절하기 위해 양이온의 흡수 및 재분배를 가속화한다. 본 실험에서도 이러한 생리적 반응이 촉진됨에 따라 종자 내부에 저장되어 있던 주요 양이온들이 유근과 유아 조직 내로 재분배 및 이동한 것으로 판단된다. 따라서 식물-희토류-양이온 간의 상호작용 및 생리적 기전을 규명하기 위해서는, 질산염의 부수적 영향을 통제할 수 있는 이온 대조구의 반영이 요구된다.
한편, Ce과 Gd는 유사한 흡수량에도 불구하고, 세포막의 지질 과산화도를 나타내는 MDA 함량에서는 두 원소 간에 상반된 반응이 관찰되었다(Table 7). Ce 처리구는 최고 농도인 1 mM에서도 유근(15.00)과 유아(18.63) 모두 대조구와 통계적으로 유의한 차이가 없었다. 본 실험 조건에서 Ce이온은 1 mM의 고농도 노출에서도 옥수수 유묘에 산화 스트레스를 유발하지 않는 것으로 확인되었다.
반면, Gd 처리구는 0.5 mM 농도에서부터 유근(18.87)과 유아(20.32)의 MDA 함량이 대조구 대비 유의미하게 증가하였다. 이는 0.5 mM 이상 수준의 Gd는 옥수수 유묘 세포 내에서 활성산소종(ROS) 축적을 유도하고, 세포막의 지질 과산화를 유도했을 것으로 판단된다. 란타넘족 원소 중 중희토류에 속하는 Gd는 경희토류인 Ce보다 이온 반경이 작아 전하 밀도가 높기 때문에, 세포 내 필수 금속 이온들의 결합 자리를 더욱 강력하게 교란하고 항상성 유지 효소 시스템을 불활성화하는 등 상대적으로 높은 식물 독성을 나타내는 것으로 보고되어 있다(Pagano et al., 2015). 또한 칼슘 이온(Ca2+)보다 큰 전하 밀도를 가져 세포막 채널에 경쟁적으로 결합하여 세포 내 신호 전달 및 양이온 흡수 체계를 직접적으로 교란한다(Henriques et al., 2019; Pinto et al., 2019). 본 연구에서도 두 원소의 체내 축적 수치가 비슷함에도 Gd 처리구에서만 유의미한 MDA 상승과 그에 따른 뿌리 형태 생장 저해가 유발된 결과는, 원소 고유의 화학적 성질 차이에서 기인한 독성 발현 메커니즘의 차이를 뒷받침하는 것으로 판단된다.
4. 결 론
본 연구는 세륨(Ce)과 가돌리늄(Gd) 처리가 옥수수 종자의 발아 및 초기 생장에 미치는 영향을 규명하였다. 설정된 농도 범위(0.1–1 mM)에서 두 원소 모두 발아 활력에는 영향을 미치지 않았으나, 발아 후 유묘 단계에서는 조직별 민감도 차이가 뚜렷했다. 외부 이온과 직접 접촉하는 유근은 고농도(0.5 mM 이상) 처리 시 신장과 표면적이 크게 억제된 반면, 지상부 조직인 유아는 생장 저해가 관찰되지 않았다. ICP-OES 및 MDA 분석 결과, 체내 희토류 이온 축적량은 두 원소 모두 농도 의존적으로 급증했으나, 세포막 손상 지표인 MDA 함량은 오직 Gd 고농도 처리구에서만 유의미하게 급증하였다.
이는 Gd는 세포막 지질 과산화를 통한 직접적인 산화 스트레스를 유발한 반면, Ce는 세포막 구조적 손상 외의 다른 생리적 저해 기전이 작용했음을 시사한다. 종합적으로 본 연구는 희토류 원소의 농도별 생장 특성과 원소별 독성 발현 차이를 밝혀냄으로써, 향후 농업 생태계 내 희토류 원소의 안전한 관리 기준 마련 및 토양 환경 오염 평가를 위한 기초 자료를 제공한다.
REFERENCES
-
Anosheh, H. P., Sadeghi, H., Emam, Y., 2011, Chemical priming with urea and KNO3 enhances maize hybrids (Zea mays L.) seed viability under abiotic stress, J. Crop Sci. Biotechnol., 14(4), 289-295.
[https://doi.org/10.1007/s12892-011-0039-x]

-
Bai, B. Z., Kastori, R., Milošević, M., 1988, Effect of elements from the scandium group on seed germination and seedling growth in soyabeans, sunflowers and sugarbeet, Zemljište i biljka, 37, 207-215, https://www.cabidigitallibrary.org/doi/full/10.5555/19900732287
[https://doi.org/10.5555/19900732287]
-
Bau, M., Knappe, A., Dulski, P., 2006, Anthropogenic gadolinium as a micropollutant in river waters in Pennsylvania and in Lake Erie, northeastern United States, Geochemistry, 66(2), 143-152.
[https://doi.org/10.1016/j.chemer.2006.01.002]
-
Belz, R. G., Piepho, H. P., 2015, Statistical modeling of the hormetic dose zone and the toxic potency completes the quantitative description of hormetic dose responses, Environ. Toxicol. Chem., 34(5), 1169-1177.
[https://doi.org/10.1002/etc.2857]
-
Brioschi, L., Steinmann, M., Lucot, E., Pierret, M. C., Stille, P., Prunier, J., Badot, P. M., 2013, Transfer of rare earth elements (REE) from natural soil to plant systems: implications for the environmental availability of anthropogenic REE, Plant Soil, 366(1), 143-163.
[https://doi.org/10.1007/s11104-012-1407-0]
-
Calabrese, E. J., Hoffmann, G. R., Stanek, E. J., Nascarella, M. A., 2010, Hormesis in high-throughput screening of antibacterial compounds in E coli, Hum. Exp. Toxicol., 29(8), 667-677.
[https://doi.org/10.1177/0960327109358917]
-
Calabrese, E. J., Mattson, M. P., 2017, How does hormesis impact biology, toxicology, and medicine?, npj Aging Mech. Dis., 3(1), 13.
[https://doi.org/10.1038/s41514-017-0013-z]
-
Chen, Z., 2011, Global rare earth resources and scenarios of future rare earth industry, J. Rare Earths, 29(1), 1-6.
[https://doi.org/10.1016/S1002-0721(10)60401-2]
-
Coolbear, P., Francis, A., Grierson, D., 1984, The effect of low temperature pre-sowing treatment on the germination performance and membrane integrity of artificially aged tomato seeds., J. Exp. Bot., 35(160), 1609-1617.
[https://doi.org/10.1093/jxb/35.11.1609]
-
Diatloff, E., Smith, F. W., Asher, C. J., 2008, Effects of lanthanum and cerium on the growth and mineral nutrition of corn and mungbean, Ann. Bot., 101(7), 971-982.
[https://doi.org/10.1093/aob/mcn021]
-
D’Aquino, L., De Pinto, M. C., Nardi, L., Morgana, M., Tommasi, F., 2009, Effect of some light rare earth elements on seed germination, seedling growth and antioxidant metabolism in Triticum durum, Chemosphere, 75(7), 900-905.
[https://doi.org/10.1016/j.chemosphere.2009.01.026]
-
Fashui, H., 2002, Study on the mechanism of cerium nitrate effects on germination of aged rice seed, Biol. Trace Elem. Res., 87(1-3), 191-200.
[https://doi.org/10.1385/BTER:87:1-3:191]
-
França, E. J., Fernandes, E. A. D. N., Bacchi, M. A., Tagliaferro, F. S., 2002, Pathway of rare-earth elements in a Brazilian forestry fragment, J. Alloys Compd., 344(1-2), 21-26.
[https://doi.org/10.1016/S0925-8388(02)00298-0]
-
Haxel, G., Hedrick, J. B., Orris, G. J., 2002, Rare earth elements: critical resources for high technology, USGS Fact Sheet 087-02, US Geological Survey, Reston, Virginia, USA.
[https://doi.org/10.3133/fs08702]
-
Heath, R. L., Packer, L., 1968, Photoperoxidation in isolated chloroplasts: I. Kinetics and stoichiometry of fatty acid peroxidation, Arch. Biochem. Biophys., 125(1), 189-198.
[https://doi.org/10.1016/0003-9861(68)90654-1]
-
Henriques, B., Coppola, F., Monteiro, R., Pinto, J., Viana, T., Pretti, C., Pereira, E., 2019, Toxicological assessment of anthropogenic Gadolinium in seawater: Biochemical effects in mussels Mytilus galloprovincialis, Sci. Total Environ., 664, 626-634.
[https://doi.org/10.1016/j.scitotenv.2019.01.341]
-
Hu, Z., Richter, H., Sparovek, G., Schnug, E., 2004, Physiological and biochemical effects of rare earth elements on plants and their agricultural significance: A Review, J. Plant Nutr., 27(1), 183-220.
[https://doi.org/10.1081/PLN-120027555]
- ISTA, 2012, International rules for seed testing, International Seed Testing Association, http://www.ingentaconnect.com/content/ista/rules
-
Kirkby, E. A., Knight, A. H., 1977, Influence of the level of nitrate nutrition on ion uptake and assimilation, organic acid accumulation, and cation-anion balance in whole tomato plants, Plant Physiol., 60(3), 349-353.
[https://doi.org/10.1104/pp.60.3.349]
-
Liang, T., Shiming, D., Wenchong, S., Chong, Z., Zhang, C., Haitao, L., 2008, A Review of fractionations of rare earth elements in plants, J. Rare Earths, 26(1), 7-15.
[https://doi.org/10.1016/S1002-0721(08)60027-7]
-
Liang, T., Zhang, S., Wang, L., Kung, H. T., Wang, Y., Hu, A., 2005, Environmental biogeochemical behaviors of rare earth elements in soil–plant systems, Environ. Geochem. Health, 27(4), 301-311.
[https://doi.org/10.1007/s10653-004-5734-9]
-
Liu, C., Liu, W. S., van Der Ent, A., Morel, J. L., Zheng, H. X., Wang, G. B., Qiu, R. L., 2021, Simultaneous hyperaccumulation of rare earth elements, manganese and aluminum in Phytolacca americana in response to soil properties, Chemosphere, 282, 131096.
[https://doi.org/10.1016/j.chemosphere.2021.131096]
-
Mohamed, A., Monnier, Y., Mao, Z., Lobet, G., Maeght, J. L., Ramel, M., Stokes, A., 2017, An Evaluation of inexpensive methods for root image acquisition when using rhizotrons, Plant Methods, 13, 11.
[https://doi.org/10.1186/s13007-017-0160-z]
-
Nawaz, F., Naeem, M., Akram, A., Ashraf, M. Y., Ahmad, K. S., Zulfiqar, B., Anwar, I., 2017, Seed priming with KNO3 mediates biochemical processes to inhibit lead toxicity in maize (Zea mays L.), J. Sci. Food Agric., 97(14), 4780-4789.
[https://doi.org/10.1002/jsfa.8347]
-
Pagano, G., Guida, M., Tommasi, F., Oral, R., 2015, Health effects and toxicity mechanisms of rare earth elements Knowledge gaps and research prospects, Ecotoxicol. Environ. Saf., 115, 40-48.
[https://doi.org/10.1016/j.ecoenv.2015.01.030]
-
Pinto, J., Costa, M., Leite, C., Borges, C., Coppola, F., Henriques, B., Freitas, R., 2019, Ecotoxicological effects of lanthanum in Mytilus galloprovincialis: Biochemical and histopathological impacts, Aquat. Toxicol., 211, 181-192.
[https://doi.org/10.1016/j.aquatox.2019.03.017]
- R Core Team, 2022, R: A Language and environment for statistical computing, R Foundation for Statistical Computing, Vienna, Austria, https://www.R-project.org
-
Ramírez-Olvera, S. M., Trejo-Téllez, L. I., García-Morales, S., Pérez-Sato, J. A., Gómez-Merino, F. C., 2018, Cerium enhances germination and shoot growth, and alters mineral nutrient concentration in rice, PLOS ONE, 13(3), e0194691.
[https://doi.org/10.1371/journal.pone.0194691]
-
Ranal, M. A., Santana, D. G. D., 2006, How and why to measure the germination process?, Braz. J. Bot., 29(1), 1-11.
[https://doi.org/10.1590/S0100-84042006000100002]
-
Schneider, C. A., Rasband, W. S., Eliceiri, K. W., 2012, NIH Image to ImageJ: 25 years of image analysis, Nat. Methods, 9(7), 671-675.
[https://doi.org/10.1038/nmeth.2089]
-
Schwabe, A., Meyer, U., Grün, M., Voigt, K., Flachowsky, G., Dänicke, S., 2012, Effect of rare earth elements (REE) supplementation to diets on the carry-over into different organs and tissues of fattening bulls, Livst. Sci., 143(1), 5-14.
[https://doi.org/10.1016/j.livsci.2011.08.010]
-
Shan, X., Wang, H., Zhang, S., Zhou, H., Zheng, Y., Yu, H., Wen, B., 2003, Accumulation and uptake of light rare earth elements in a hyperaccumulator Dicropteris dichotoma, Plant Sci., 165(6), 1343-1353.
[https://doi.org/10.1016/S0168-9452(03)00361-3]
-
Stein, R. T., Kasper, A. C., Veit, H. M., 2022, Recovery of rare earth elements present in mobile phone magnets with the use of organic acids, Minerals, 12(6), 668.
[https://doi.org/10.3390/min12060668]
-
Throneberry, G. O., Smith, F. G., 1955, Relation of respiratory and enzymatic activity to corn seed viability, Plant Physiol., 30(4), 337-343.
[https://doi.org/10.1104/pp.30.4.337]
-
Van Beusichem, M. L., Kirkby, E. A., Baas, R., 1988, Influence of nitrate and ammonium nutrition on the uptake, assimilation, and distribution of nutrients in Ricinus communis, Plant Physiol., 86(3), 914-921.
[https://doi.org/10.1104/pp.86.3.914]
-
Wang, Y. Q., Sun, J. X., Chen, H. M., Guo, F. Q., 1997, Determination of the contents and distribution characteristics of REE in natural plants by NAA, J. Radioanal. Nucl. Chem., 219(1), 99-103.
[https://doi.org/10.1007/BF02040273]
-
Hu, X., Wang, X. R., Wang, C., 2006, Bioaccumulation of lanthanum and its effect on growth of maize seedlings in a red loamy soil, Pedosphere, 16(6), 799-805.
[https://doi.org/10.1016/S1002-0160(06)60116-1]
-
Yuan, Y., Cave, M., Zhang, C., 2018, Using Local Moran's I to identify contamination hotspots of rare earth elements in urban soils of London, Appl. Geochem., 88, 167-178.
[https://doi.org/10.1016/j.apgeochem.2017.07.011]
Department of Plant Resources and Landscape Architecture, Hankyong National Universityymh5240@hknu.ac.kr
Department of Plant Resources and Landscape Architecture, Hankyong National Universityleesj9691@naver.com
Department of Plant Resources and Landscape Architecture, Hankyong National Universityyoonshark97@naver.com
Department of Plant Resources and Landscape Architecture, Hankyong National Universityhybb0412@naver.com
Institute of ecological phytochemistry, Hankyong National Universitylsn136@hknu.ac.kr
Institute of ecological phytochemistry, Hankyong National Universitytaewkim@hknu.ac.kr