
추가 용수공급을 고려한 안동댐-임하댐 연계운영 신뢰도 평가
Ⓒ The Korean Environmental Sciences Society. All rights reserved.
This is an Open-Access article distributed under the terms of the Creative Commons Attribution Non-Commercial License (http://creativecommons.org/licenses/by-nc/3.0) which permits unrestricted non-commercial use, distribution, and reproduction in any medium, provided the original work is properly cited.
Abstract
This study analyzed the reliability, resilience, and vulnerability of the Andong and Imha dams under the condition of supplying an additional 630,000 tons of water per day while planned water supply plans. To achieve this, various supply scenarios were constructed by allocating the additional water demand between the Andong and Imha dams at ratios ranging from 10% to 90% in 5% increments. The analysis of water shortage frequency revealed an optimal intersection at an allocation rate of 55–65% for the Andong Dam across all operating rules (Rules A, B, and C), indicating that assigning 5–15% more supply to the Andong Dam is advantageous. Conversely, regarding water shortage volume, the optimal intersection occurred at 40–45% for the Andong Dam, suggesting that a higher allocation to the Imha Dam is more effective in minimizing the shortage volume. In terms of reliability, frequency reliability was highest at an Andong-to-Imha allocation ratio of 55–60:45–40 across all rules. Similarly, amount reliability peaked at 88% with a 60:40 ratio, demonstrating that allocating an additional 10% or more to the Andong Dam improves overall water supply performance. Regarding resilience, Rule B exhibited the fastest recovery from a water shortage to a normal state at an allocation ratio of 65:35. While vulnerability was lowest (1.91 at the CP point) under Rule C with a 90:10 ratio, such an extreme concentration on the Andong Dam is deemed impractical for optimal water distribution. Consequently, when jointly operating the Andong and Imha dams for additional water supply, an allocation ratio of 60:40 (Andong to Imha) under Rule B—which comprehensively considers both inflow and storage—is determined to be the optimal supply strategy. The findings of this study can serve as a valuable reference for establishing future operational plans to secure additional water resources through the linked operation of these two dams.
Keywords:
Water supply, Allocation rule, Parallel reservoir, Reliability, Resilience, Vulnerability1. 서 론
기후변화의 변동성과 불확실성이 커지고 용수수요 증가에 따라 수자원의 안정적이고 지속적인 확보를 위한 지역별 요구는 중요한 이슈가 되고 있다. 낙동강 유역에서 오랜기간 동안 지속되고 있는 용수공급을 위한 취수원 이전 문제는 10년 이상에 걸쳐 취수원의 다변화를 위해 협의를 지속해 온 사안으로, 다양한 방안이 제시되고 논의되었다, 용수공급에 대한 다양한 기법을 적용한 연구는 오랜기간 수행되었으며, Clark(1950, 1956)의 연구에서 상수도 시스템의 안정적인 용수공급을 위해 Rule curve를 개발하여 저수지의 설계에 방법론을 제시하였다. Loucks and Dorfman(1975)는 용수공급문제 해결을 위해 저수지 선형최적화 모형을 적용하였으며, Sand(1984)는 병렬 저수지의 용수공급능력에 대해 연구하였다. Sharon and Konstant(1991)은 대규모 저수지 시스템의 분석에서 전문가의 경험과 직관에 기반한 방법론을 모형으로 적용한 바 있다. Park(2005)와 Park et al.(2007)는 병렬저수지 용수공급에서 양적신뢰도와 빈도기준 신뢰도, 복원도, 취약도를 평가하였다. Kim et al.(2008)은 갈수기의 한강수계 댐 용수공급에서 가능한 유하량을 분석하였다. Choi et al.(2020)은 부족분 공급방식으로 한강수계 시스템에 적용하여 공급능력과 신뢰도를 평가히였다. Kim et al.(2023)은 K-has 모형을 이용하여 인근 저수지간의 비상 연계 시스템을 구축한 경우 추가로 확보할 수 있는 용수공급 가능량을 산정한 바 있다. Park and Park(2023)은 병렬저수지의 연계운영을 통해 추가용수공급량을 할당하여 공급할 경우에 대해 신뢰도 지표 평가를 통해 최적 배분비율을 산정한 연구를 수행하였다. Lee et al.(2024)는 극한 가뭄에 대비하여 최소유입량을 예측하여 저수지 연계운영과 용수공급 안정성 확보방안에 대해 연구한 바 있다. Longyang et al.(2024)는 기후변화와 저수지 퇴사로 인한 저수지 용량 감소에 따른 저수지 운영을 재평가하여 저수지 용량 재할당과 회복탄력성을 높이는 방안을 제시하였다. Kim et al.(2025)는 섬진강 수계의 다목적 댐 운영에서 일정량 공급방식과 부족분 공급방식을 혼합운영하여 미래 용수공급 능력을 정량적으로 평가하였다. Lee et al.(2026)는 SWMM 모형을 이용하여 실제 농업용수 관계 패턴과 저수지 용수 분배효율에 대한 평가체계를 제안하였다. He et al.(2026)의 연구에서는 저수지 최적운영 룰을 적용하였을 경우 가뭄의 발생빈도에 대해 연구하였다. Sedighkia and Datta(2026)은 기후변화와 인구증가에 따른 환경유량이 용수공급 신뢰도의 영향에 대해 평가하였다.
본 연구에서는 낙동강 유역의 추가 용수를 공급하기 위해 안동댐과 임하댐의 두 댐을 연계하여 하루 63만 톤 규모의 용수를 공급하는 것에 대해 Park(2005), Park et al.(2007, 2023)이 국내 저수지 여건에 적합하도록 개발한 병렬저수지 Allocation Rule A, B, C를 적용하여, 안동댐과 임하댐의 공급비율을 17가지 배분 시나리오(안동댐 10∼90%, 5% 단위)로 설정하여 용수공급에 대한 신뢰도를 평가하였다.
2. 연구방법
2.1. Allocation Rule 기본이론
본 연구에서 병렬저수지의 용수공급 분석을 위해 적용한 기본 이론은 저수지의 총저류량과 유입량의 규모를 고려하여 저수지별 용수공급의 배분에 대한 할당비율을 고려한 Revell(1969)가 제안하고 Park(2005), Park et al.(2007, 2023)이 국내 저수지 여건에 맞게 변형한 3가지 배분 Rule을 적용하였다.
- (1) Rule A : 저류량 기반 배분
각 댐의 현재 저류량(S_t) 비율에 따라 할당 배분계수(AC) 결정. 단순하고 직관적이나 유입량 변화에 둔감. - (2) Rule B : 저류량 + 유입량 기반 배분
전월 저류량(S_{t-1})과 당월 유입량(I_t)의 합에 따라 AC 결정. 유입 변동성을 반영하여 더 동적으로 운영 가능. - (3) Rule C : (저류량+유입량)/총저수용량 기반 배분
(S_{t-1}+I_t)를 총저수용량(K)으로 정규화하여 AC 결정. 댐 규모 차이를 고려한 상대적 공급 능력 반영.
2.2. 분석 조건 및 시나리오 구성
- (1) 분석 기간: 1993년 1월 ∼ 2024년 12월 (총 384개월)
- (2) 추가 용수공급량: 일 63만톤 (월별 공급량으로 환산 적용)
- (3) 배분 시나리오: 안동댐 10%∼90% (5% 단위, 총 17개 시나리오)
- (4) 홍수기(7∼9월): 계획용수공급량 전량 공급 (Rule 미적용)
- (5) 초기조건: 만수위
- (6) 하한 조건: 저수위 기준 저류량 / 상한 조건: 만수위 저류용량
- (7) CP (control point) : 안동댐과 임하댐의 공급량을 합하여 평가하는 조절점
2.3. 용수공급 평가 지표
안동댐과 임하댐의 용수공급을 위한 연계운영에 대한 평가를 위해 Hashimoto et al.(1982)이 제안한 신뢰도(양적신뢰도, 빈도신뢰도)-복원도-취약도 3요소 체계를 기반으로 4개 지표를 산정하였으며 Table 1과 같다.

Water supply evaluation indices
본 연구에서는 안동댐, 임하댐의 연계운영시 월 단위 분석 기간을 기준으로 빈도기준 신뢰도와 양적기준 신뢰도, 복원도와 취약도를 산정함으로써 용수공급 능력을 종합적으로 평가하였다. 각 댐의 기존 계획 용수공급량(㎥/s)과 추가 공급해야 하는 일 63만 톤의 수량을 적용하였으며, 신뢰도 분석은 월 단위로 수행되기 때문에 관련 자료를 월별 공급량으로 변환하여 적용하였으며 Table 2와 같다.
Andong and Imha dam allocation flow for additional water supply(Unit : ㎥/s)
3. 분석결과
3.1. 용수공급 부족횟수 및 용수부족량 검토
384개월 분석 기간 중 안동댐·임하댐 배분비율(10%~90%) 변화에 따른 용수공급 부족횟수를 Table 3과 같이 나타났으며 용수부족량은 Table 4와 같이 분석되었다. 배분비율이 클수록 해당 댐의 부족횟수가 증가하는 상반된 특성이 나타나며, 두 댐의 부족횟수가 교차하는 지점이 가장 균형 잡힌 최적 배분점으로 판단하였다.
Comparison by allocation rule(Water supply deficits No.
Comparison by allocation rule [Water supply deficits amounts (106 ㎥)]
부족횟수의 경우 Table 3에 나타난 바와 같이 Rule (A)에서는 안동댐과 임하댐의 배분비율이 55:45와 60:40 일 경우 CP에서 81회로 가장 적게 나타났으며, 안동댐과 임하댐의 부족횟수는 각각 58와 59 그리고 61과 54회 부족이 발생한 것으로 나타났다. Rule (B)의 경우 안동댐과 임하댐의 배분비율이 65:35일 때 CP에서 부족횟수가 77회로 가장 적게 나타났으며, 이때 안동댐과 임하댐의 부족횟수는 65와 56회로 나타났다. Rule (C)의 경우에서는 안동댐과 임하댐의 배분비율이 60:40과 65:35에서 CP의 부족횟수가 80회로 가장 적게 나타났으며, 이때 안동댐과 임하댐의 부족횟수는 각각 62와 67 그리고 66과 62회 부족이 발생한 것으로 분석되었다.
Table 4에 나타난 부족량의 발생에서는 CP 기준으로 Rule (A)에서는 안동댐과 임하댐의 배분비율이 55:45일 경우 6,320.5억 톤/년으로 가장 적은 부족이 발생하였으며, Rule (B)의 경우에는 안동댐과 임하댐의 배분비율이 60:40일 때 6,350.3억 톤/년으로 가장 적은 부족이 발생하였다. Rule (C)의 경우에는 안동댐과 임하댐의 배분비율이 50:50일 때 6,240.7억 톤/년으로 가장 적은 부족이 발생하는 배분비율로 분석되었다.
빈도기준과 양적기준의 신뢰도 분석결과 빈도기준에서는 Rule (B)의 안동댐과 임하댐의 배분비율 65:35일 경우 CP에서 부족횟수가 77회로 가장 작게 분석되었으며, 이 때 부족량은 6,626.6억 톤/년으로 분석되었다. 부족량 기준으로는 Rule (C)에서 50:50의 배분비율에서 CP에서 6,240.7억 톤/년으로 가장 작게 분석되었으며, 이 때 Rule (C)의 CP에서의 부족횟수는 85회로 분석되었다.
부족횟수와 부족량을 기준으로 최적의 배분비율을 선정하기 위하여 안동댐과 임하댐 그리고 CP 지점에 대한 부족횟수와 부족량에 대해 도시한 결과 안동댐과 임하댐이 교차하는 지점을 기준을 최적 배분비율로 선정한 결과가 Table 5와 같다.
Results of water supply deficit frequency and water shortage volume Analysis
3.2. 신뢰도, 복원도, 취약도 검토
안동댐과 임하댐의 유량배분(10%~90%) 시나리오에 따라 일 63만 톤의 추가 용수공급을 할 경우 빈도기준 신뢰도 및 양적기준 신뢰도, 복원도와 취약도의 분석결과를 검토하였다. 빈도기준 신뢰도는 384개월 중 공급 부족이 발생하지 않은 월의 비율로, 공급 신뢰성의 기본 척도이다. 안동댐과 임하댐의 신뢰도와 부족량을 고려하여 최적 배분비율을 검토하였다. 양적기준 신뢰도는 전체 수요량 대비 공급량의 비율로, 공급 부족의 양적 규모를 반영한다. 본 연구에서 Rule A/B/C 모두 60:40 구간에서 최대 88%를 기록하였으며, 이는 3가지 Rule 간 수량적 성능이 일치하는 안정적 구간으로 판단되었다. 복원도는 공급 부족 발생 후 정상 상태로 회복하는 속도를 나타내며, 값이 낮을수록 빠른 회복을 의미하며, 취약도는 부족 발생 시 피해 규모를 정량화한 지표로, 역시 낮을수록 우수한 지표이다.
추가배분 시나리오에 따른 빈도기준 신뢰도와 양적기준 신뢰도 분석결과는 Table 6과 같으며, 빈도기준 신뢰도의 경우 Rule (A)는 안동댐과 임하댐의 배분비율이 55:45일 경우, Rule (B)는 65:35, Rule (C)의 경우는 60:40이 최대의 신뢰도를 나타내는 것으로 나타났으며, 양적기준 신뢰도의 경우 Rule (A)는 55:45, Rule (B)는 60:40, Rule (C)는 50:50으로 분석되었다.
Evaluation results of frequency and quantity reliability
복원도와 취약도의 분석결과는 Table 7과 같으며, 복원도의 경우 Rule (A)와 Rule (B)에서 65:35 배분비율에서 최소값이 나타났으며, Rule (C)의 경우 20:80으로 분석되었다. 취약도의 경우 Rule (A)는 55:45, Rule (B)에서 65:35 배분비율에서 최소값이 나타났으며, Rule (C)는 90:10으로 분석되었다. Rule (C)에서 복원도에서는 임하댐이 크게 나타나는 이유는 임하댐의 용량에 비해 유역면적은 안동댐과 유사하여 임하댐의 유입량이 유입되어 빨리 정상상태로 복원되는 이유로 판단되며, 취약도에서 안동댐의 비율이 크게 나온 것은 총저류량과 유입량이 임하댐에 비해 크므로 안동댐의 할당 비율이 높게 산정되는 것으로 판단된다. 각 시나리오에 따른 분석결과는 Fig. 1~Fig. 6에 나타내었다.
Evaluation results of resiliency and vulnerability
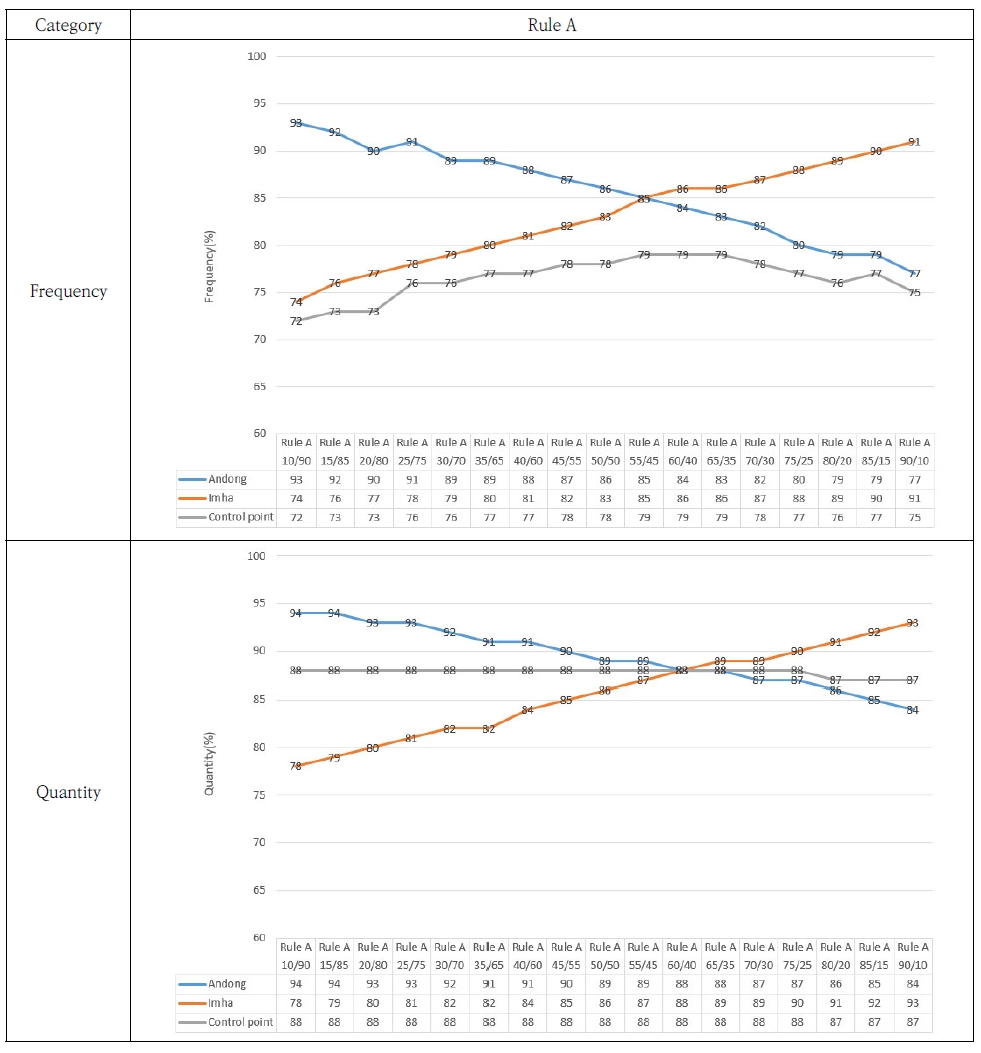
Comparison of frequency & quantity (Rule A).
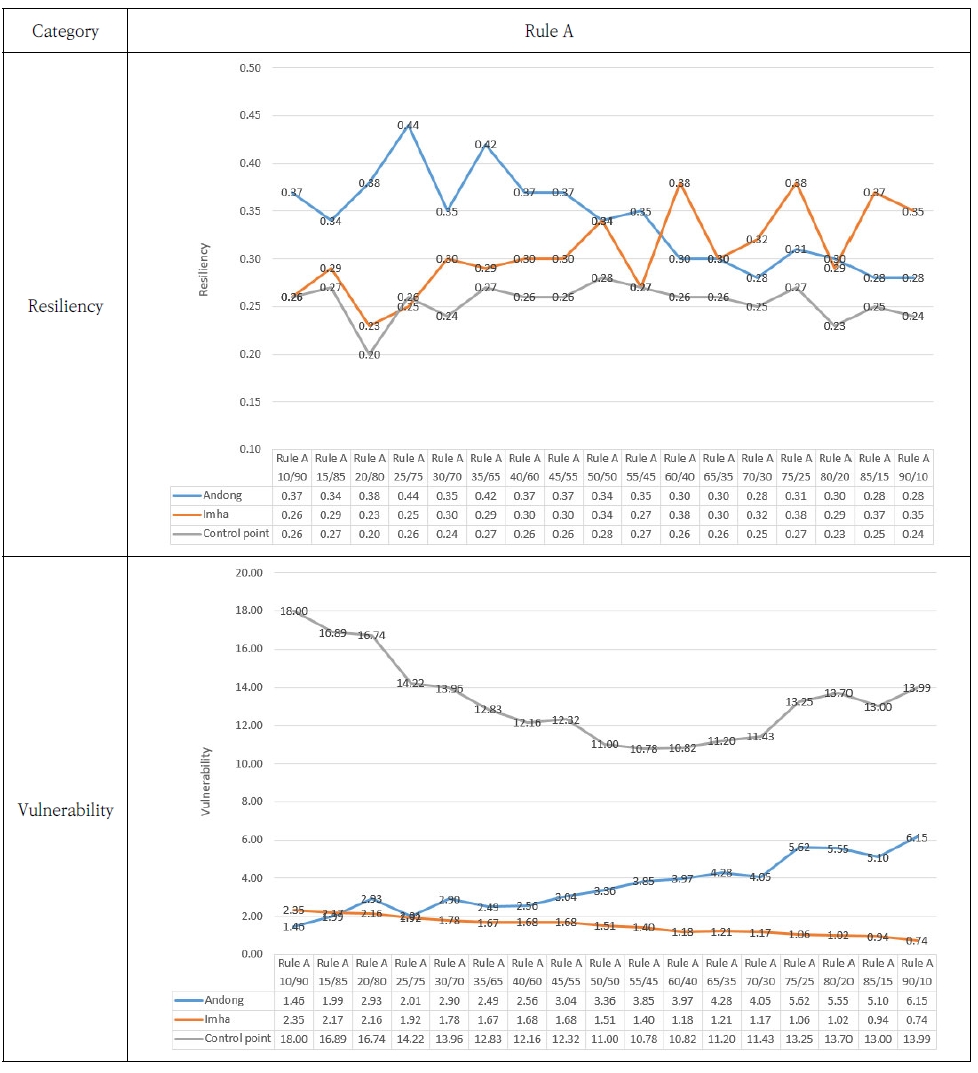
Comparison of resiliency & vulnerability (Rule A)
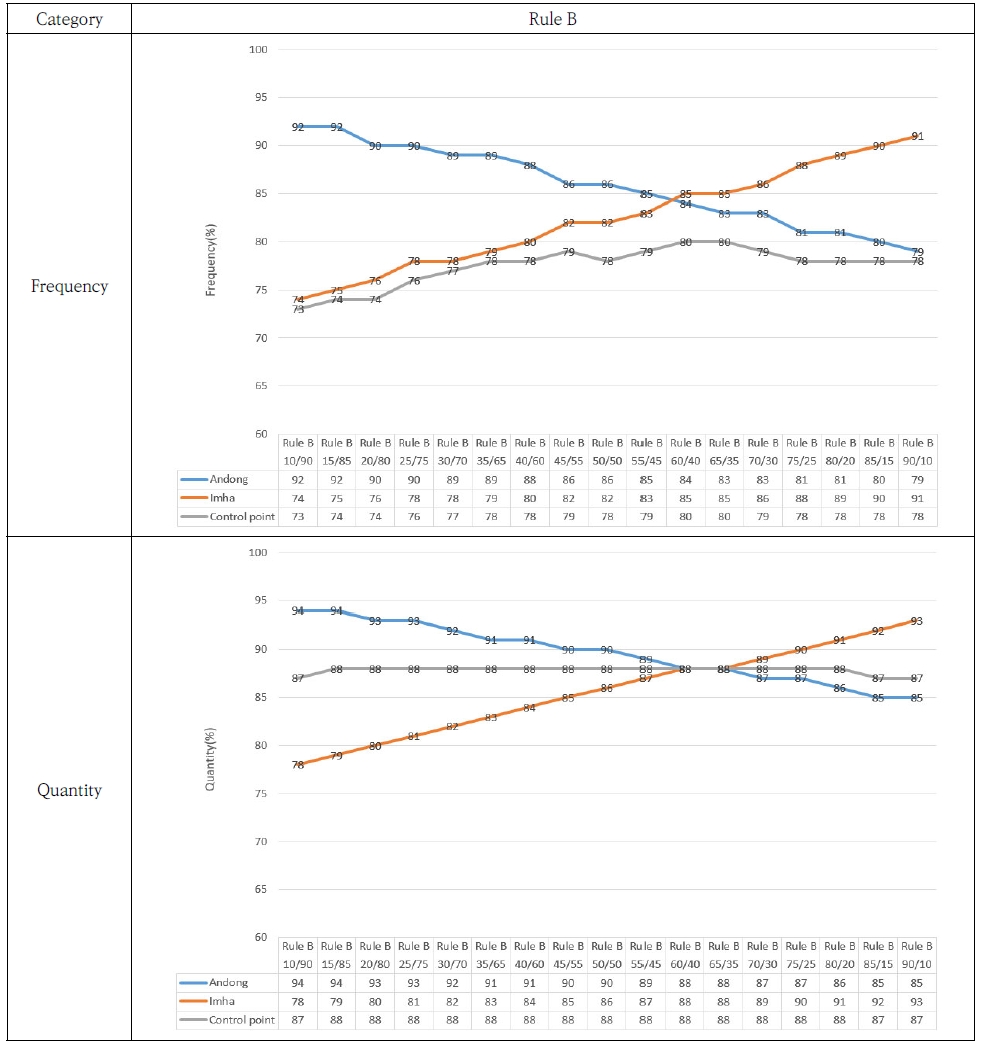
Comparison of frequency & quantity (Rule B).
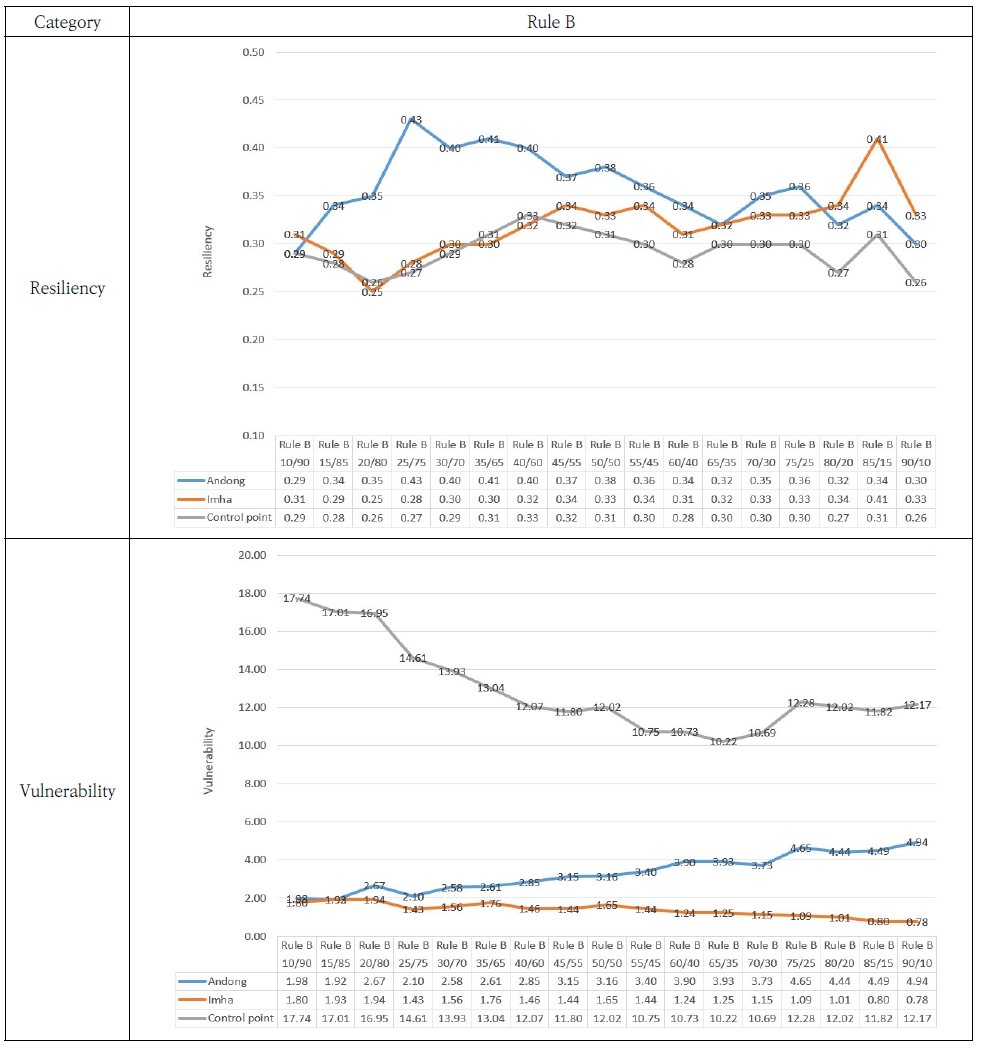
Comparison of resiliency & vulnerability (Rule B).
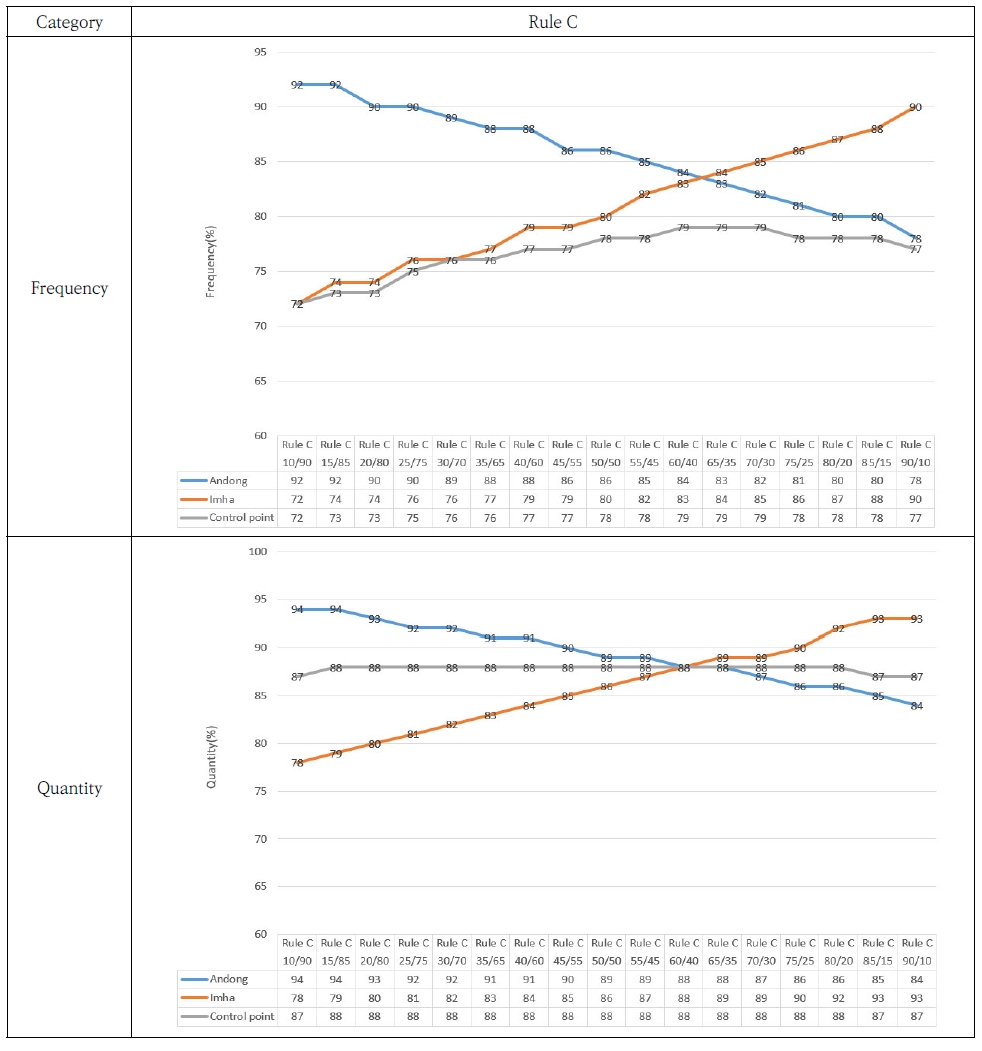
Comparison of frequency & quantity (Rule C).
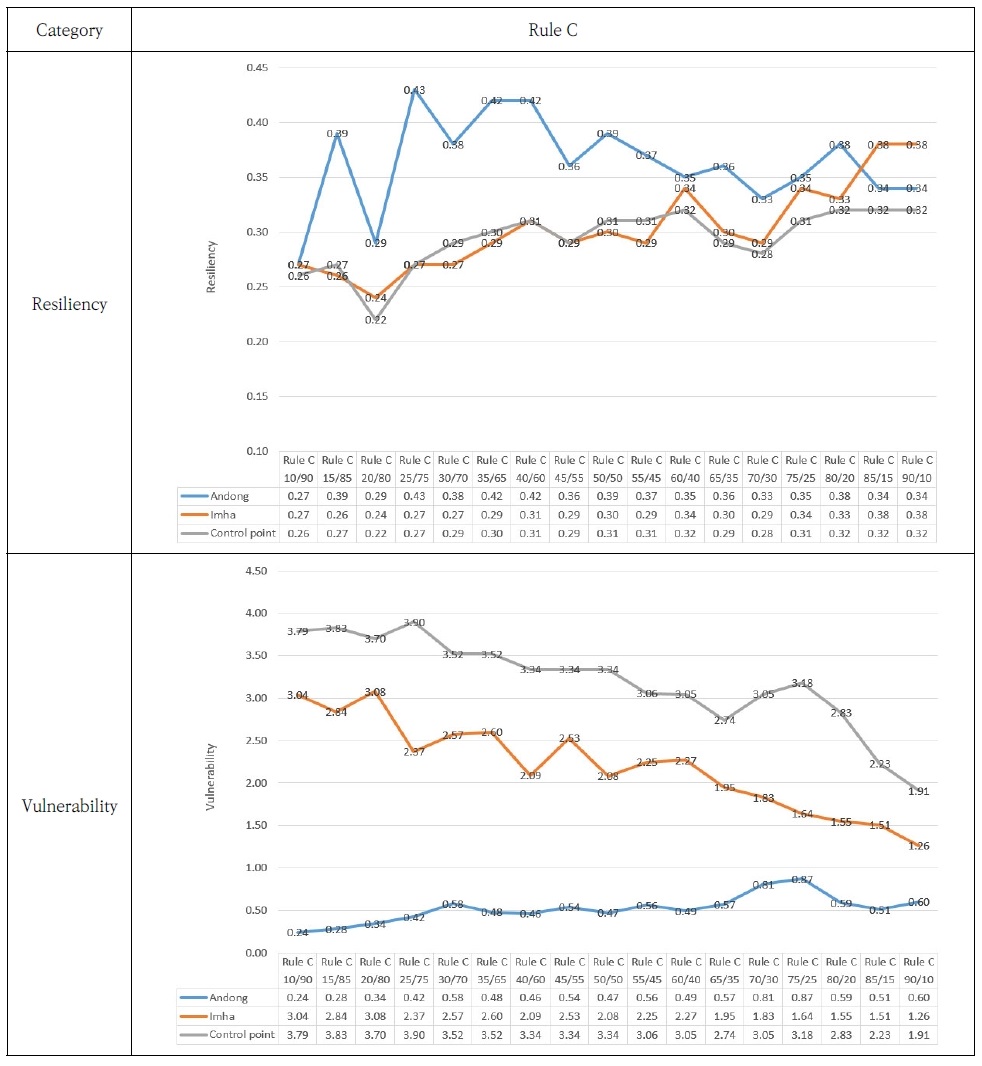
Comparison of resiliency & vulnerability (Rule C).
4. 결 론
본 연구는 기존의 안동댐 및 임하댐 용수공급 계획을 유지한 상태에서, 일 63만 톤의 추가 용수수요량을 공급할 경우 안동댐과 임하댐의 신뢰도와 복원도, 취약도를 분석하였다. 이를 위해 추가용수공급량을 안동댐과 임하댐에 각각 10%에서 90%까지 5% 단위의 비율로 배분하여 총 100% 공급 시나리오를 구성하여 분석한 결과에 대한 결론은 다음과 같다.
안동댐과 임하댐의 용수공급 부족횟수 분석결과에서는 Rule A/B/C 모두 안동댐 55~65% 배분 구간에서 최적의 신뢰도를 나타내는 것으로 분석되었으며, 안동댐이 임하댐보다 5%에서 15% 더 공급하는 것이 부족횟수 발생 측면에서는 유리한 것으로 분석되었다. 용수부족량의 경우에서는 안동댐에서 5~10% 더 공급하는 것이 유리한 것으로 분석되었다.
신뢰도 분석에서 빈도기준 신뢰도는 Rule (A), Rule (B), Rule (C) 모두 안동댐-임하댐 용수배분비율 55~60:45~40에서 신뢰도가 가장 높은 것으로 검토되어 안동댐의 배분비율 5%이상 높은 경우 신뢰도가 높게 나타났다. 양적기준 신뢰도는 Rule (A), Rule (B), Rule (C) 모두 안동댐-임하댐 용수배분비율에서 안동댐의 배분비율이 5~10%높은 것이 88% 신뢰도로 가장 높은 것으로 분석되었다.
용수공급에 따른 복원도와 취약도의 분석결과에서는 Rule (A), Rule (B), Rule (C) 모두를 고려할 때 Rule (B)에서 안동댐-임하댐 용수배분비율 65:35에서 가장 최소로 나타나 용수공급 부족에서 정상상태로 빨리 회복하는 것으로 분석되었으며, 취약도는 Rule (C)에서는 안동댐-임하댐 용수배분비율 90:10일 때 CP 지점에서 1.91로 가장 낮게 검토되었으나 안동댐 집중으로 최적의 배분에는 문제가 있을 것으로 판단된다.
따라서 안동댐과 임하댐을 연계하여 추가 용수공급을 할 경우 유입량과 저류량을 고려한 Rule (B)의 기준으로 안동댐과 임하댐의 추가 용수배분비율이 60:40일 경우 CP기준 빈도기준 신뢰도 80%, 양적기준 신뢰도 88%, 복원도 0.28, 취약도 10.73으로 최적의 공급방안으로 판단된다.
REFERENCES
- Clark, E., J., 1950, New York control curves, J. Am. Water Works Assoc., 42(9), 823-857.
- Clark, E., J., 1956, Imponding reservoirs, J. Am. Water Works Assoc., 48(4), 349-354.
- Choi, Y. J., Lee, E. K., Ji, J. W., Yi, J. E., 2020, Water yield evaluation of a reservoir system based on a deficit supply in the Han river basin, KSCE, 40(5), 477-484.
-
Hashimoto, T., Stedinger, J. R., Loucks, D. P., 1982, Reliability, resiliency, and vulnerability criteria for water resources system performance evaluation, W.R.R., 18(1), 14-20.
[https://doi.org/10.1029/WR018i001p00014]

-
He, S., Sun, S., Liu, Y., Chen, K., Zhu, L., Gong, Y., 2026, Projections of future hydrological drought in a reservoir-regulated region: The roles of climate change and reservoir operation, Hydrol. Earth Syste Sci., 30(11), 3529-3547.
[https://doi.org/10.5194/hess-30-3529-2026]
- Kim, H. Y., Lee, S. H., Na, R., Joo, D. H., Yoo, S. H., 2023, Analysis of the emergency water supply capacity in agricultural reservoirs using K-HAS and ratio correction factors, KSAE, 65(2), 59-71.
-
Kim, Y. K., Choi, G. W., Ham, M. S., Kim, N. W., 2008, The analysis of potential discharge by dam in Han river basin at dry season, KWRA, 41(11), 1143 –1152.
[https://doi.org/10.3741/JKWRA.2008.41.11.1143]
-
Kim, W. J., Choi, S. J., Kang, S. K., Woo, S. Y., 2025, Evaluation of future water supply capacity based on multipurpose dam operation methods in Seomjin River Watershed, J. Korean Soc. Hazard Mitig., 25(2), 121-127.
[https://doi.org/10.9798/KOSHAM.2025.25.2.121]
- Lee, C. H., Lee, S. M., Lee, E. K., Ji, J. W., Yoon, J. I., Yi, J. E., 2024, Predictive analysis of minimum inflow using synthetic inflow in reservoir management: A Case study of Seomjingang Dam, J. Korea Water Resour. Assoc., 57(5), 311-320.
- Lee, J. Y., Shin, A. K., Kim, C. Y., We, S. M., Jeong, Y. J., Jin, Y. K., Lee, D. J., Han, J. H., Lim, K. J., 2026, Comparison of field- and lateral-scale SWMM Models for simulating water supply and irrigation in agricultural reservoir service areas, KSWE., 42(1), 65-76.
-
Li, D., Cai, X., 2024, Uncovering historical reservoir operation rules and patterns across U.S. reservoirs, W.R.R., 60(8), e2023WR036686.
[https://doi.org/10.1029/2023WR036686]
-
Longyang, Q., Zeng, R., 2024, Assessing the effectiveness of reservoir operation and identifying reallocation opportunities under climate change, Environ. Res. Lett., 19(7), 074010.
[https://doi.org/10.1088/1748-9326/ad5459]
-
Loucks, D. P., Dorfman, P. J., 1975, An Evaluation of some linear decision rule in chance-constrainted models for reservoir planning operation, W.R.R., 11(6), 777-782.
[https://doi.org/10.1029/WR011i006p00777]
-
Park, K. B., 2005, A Study of reliability index correlation analysis in reservoir water-supply, J. Environ. Sci. Int., 14(3), 289-296.
[https://doi.org/10.5322/JES.2005.14.3.289]
- Park, K. B., Jee, H. K., Lee, S. T., 2007, The capability analysis of water supply for the parallel reservoir system by allocation rules, JKSWW, 21(2), 215-224.
-
Park, J. M., Park, K. B., 2023, Analysis of parallel reservoir water supply capacity according to water supply changes, J. Environ. Sci. Int., 32(10), 675-684.
[https://doi.org/10.5322/JESI.2023.32.10.675]
-
ReVelle, C., Joeres, E., Kirby, W., 1969, The Linear decision rule in reservoir management and design: 1, Development of the stochastic model, W.R.R., 5(4), 767-777.
[https://doi.org/10.1029/WR005i004p00767]
- Sand, G. M, 1984, An Analytical investigation of water supply reservoir in parallel, Ph. D. thesis, Cornell Univ., Ithaca, N. Y.
-
Sedighkia, M., Datta, B., 2026, Assessing environmental flow reliability through reservoirs under climate change and population growth, Sustainability, 18(11), 5222.
[https://doi.org/10.3390/su18115222]
-
Sharon A, J., Konstant, S., 1991, Heuristic operating policies for reservoir system simulation, W.R.R., 27(5), 673-685.
[https://doi.org/10.1029/91WR00320]
Department of Architectural and Civil Engineering of Kyungil University onionwol@naver.com
Department of Architectural and Civil Engineering of Kyungil University pkb5032@kiu.kr